
Symmetrical Triangle and Falling Wedge Patterns
In this update, we’ll explore the recent price action of XRP Coin, focusing on its movement within a symmetrical triangle and a falling wedge pattern. We’ll analyze the current setup and potential future movements.
Overview of the Symmetrical Triangle
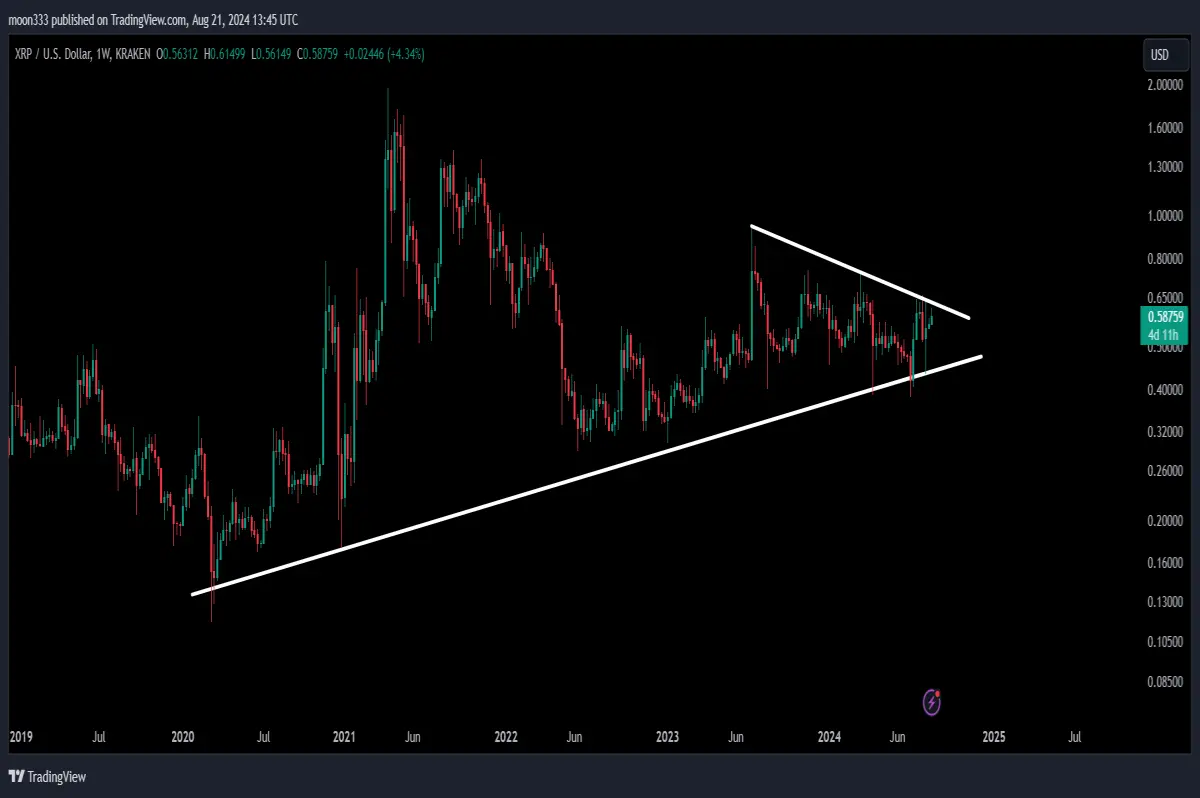
XRP Coin has formed a significant symmetrical triangle pattern on the weekly time frame chart. This pattern is a critical technical formation that often signals a potential breakout.
- Current Position: The price is currently approaching the resistance level of this symmetrical triangle. In recent weeks, it has bounced off the support level of the triangle and is now testing the upper boundary.
- Recent Movements: Just a couple of weeks ago, XRP bounced off the support of the triangle and has since been moving towards the resistance.
Historical Context and Support Levels
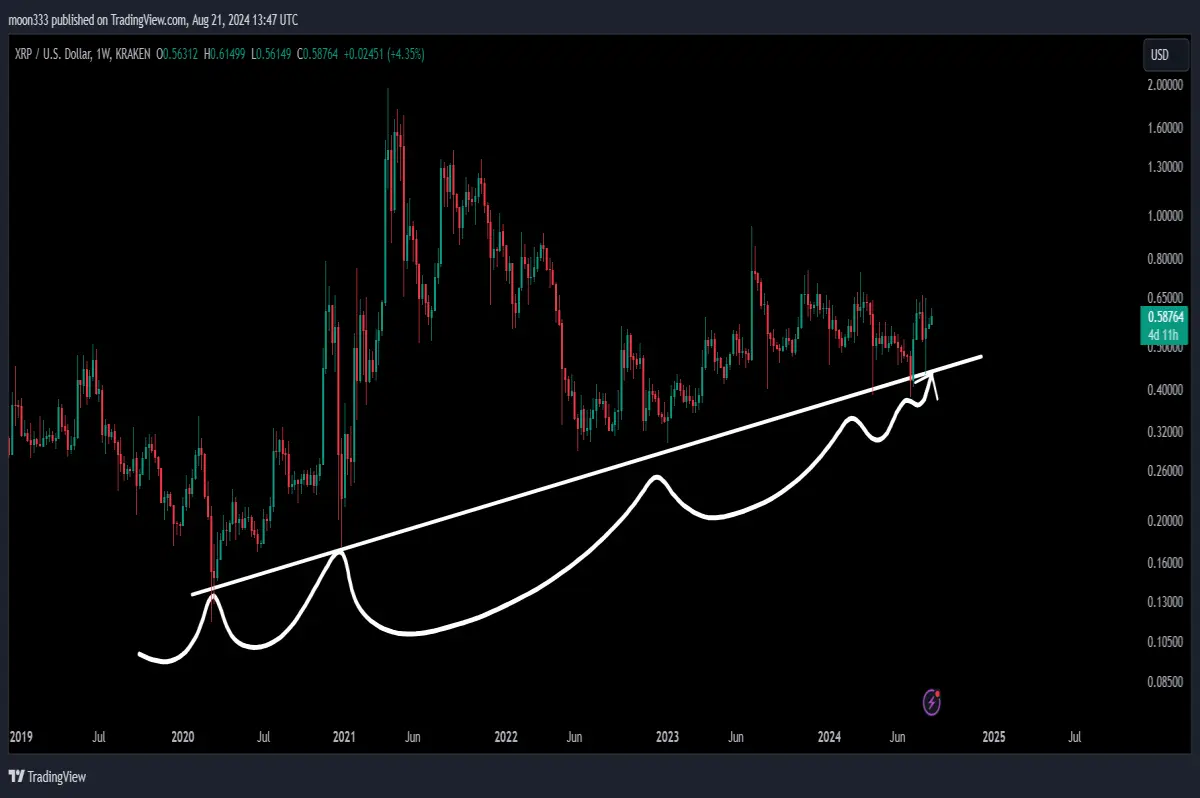
The symmetrical triangle’s support line extends back to March 2020, following the initial COVID-19 market crash. This support has held several times, indicating its significance.
- Historical Support: The price tested this support multiple times, including significant drops and rallies. Recent attempts to break down were met with strong bounces.
- Current Support: As of early August 2024, after a significant sell-off, the price tested this support again and bounced back, showing resilience.
For detailed analysis, you can watch the below video:
Analysis of the Falling Wedge Pattern
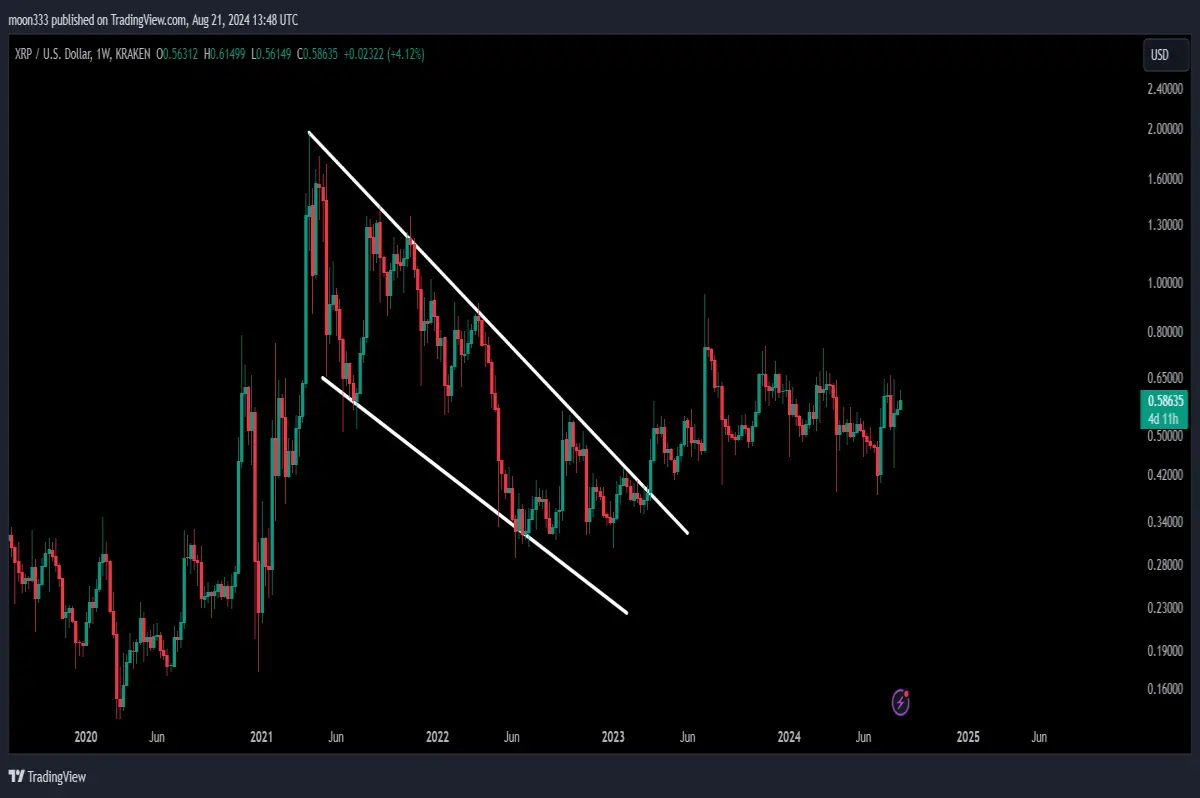
On the 7-day time frame chart, XRP has also broken out of a long-term falling wedge pattern. This breakout could signal a bullish trend reversal.
- Previous Falling Wedge: A similar falling wedge pattern was observed from April 2018 to July 2020. The breakout target from that wedge was around $1, and a similar target has been set for the current wedge.
- Current Target: The technical target for the breakout from the falling wedge pattern is approximately $2.
Potential Breakout and Technical Targets
Given the current price action, XRP Coin is on the verge of a potential breakout from the symmetrical triangle. If the resistance is breached, a substantial price movement is expected.
- Symmetrical Triangle Target: The technical target for a breakout from the symmetrical triangle is around $1.75.
- Falling Wedge Target: The breakout from the falling wedge pattern suggests a potential target of approximately $2.
Conclusion
XRP Coin is currently navigating a critical juncture within its symmetrical triangle and falling wedge patterns. The price action indicates a potential breakout soon, with targets set at $1.75 and $2, respectively.
For more detailed trading signals and updates, consider subscribing to the channel or joining as a YouTube or Patreon member. Links for joining and accessing trading signal reports are available in the video description.






