Hey, friends hope you are well and welcome the new update on Polkadot (DOT). In this video you will watch how:
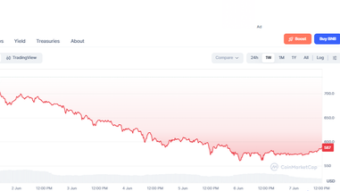
On a daily chart, the price action of DOT is moving in a down channel and making a powerful attempt the breakout the resistance of this channel.
Click here to create an account on Binance, the best place to buy or sell Polkadot coin
On the small-time period 4-hour chart the price action has broken out all simple moving averages with the time period of 25, 50, and 100.
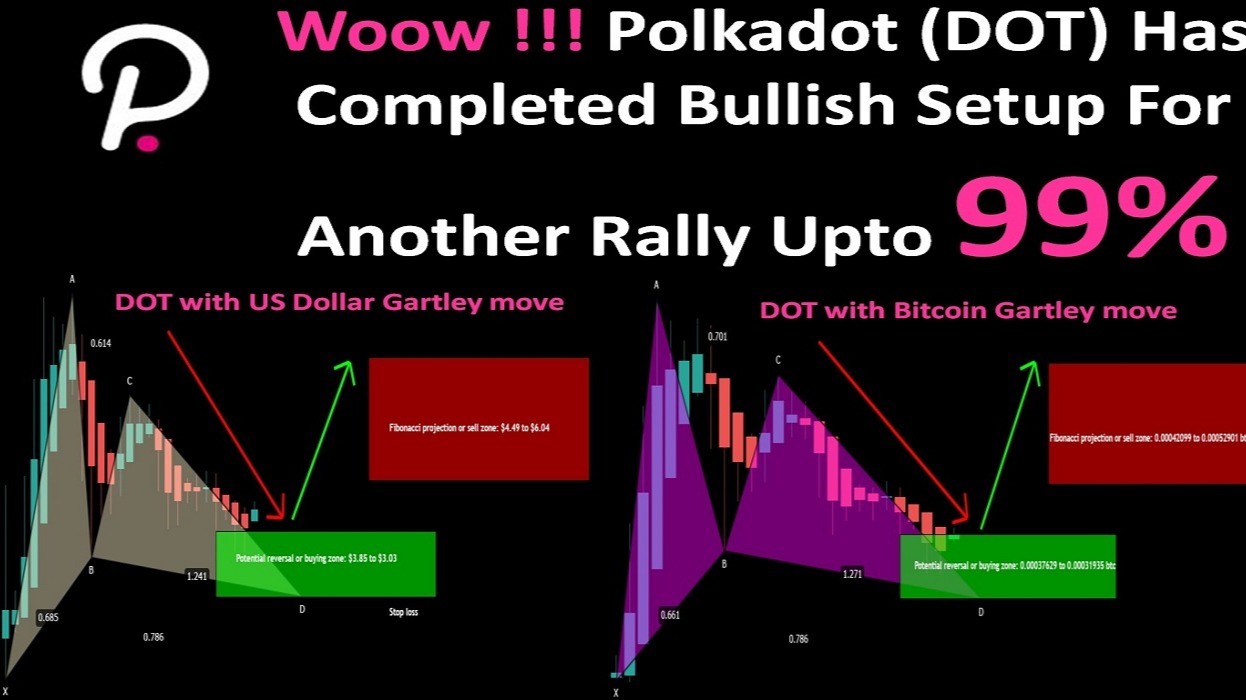
Now I would like to draw your attention towards a powerful bullish move of the Polkadot coin that it has formed a bullish Gartley pattern in the US Dollar market and the Bitcoin markets as well. The patterns and targets are as below:
Polkadot with US Dollar pair Gartley move:
The priceline of Polkadot (DOT) with USDT pair has formed bullish Gartley on the 2-day chart.

The targets as per the Fibonacci sequence of Gartley are:
Potential reversal or buying zone: $3.85 to $3.03 (this is stop loss as well)
Fibonacci projection or sell zone: $4.49 to $6.04
Polkadot with Bitcoin pair Gartley move:
The priceline of Polkadot (DOT) with the Bitcoin pair has formed bullish Gartley the same as with US Dollar pair on the 2-day chart.

Click here to create free account on tradingview to watch and play the chart on realtime
The targets as per Fibonacci sequence of Gartley are:
Potential reversal or buying zone: 0.00037629 to 0.00031935 btc
Fibonacci projection or sell zone: 0.00042099 to 0.00052901 btc
Conclusion:
The price action of Polkadot is showing a very positive gesture as it has broken out all SMAs with a time period of 25, 50, and 100 on a 4-hour chart and likely to breakout the resistance of the channel soon. However, we should use the potential reversal zone as stop-loss because if this PRZ level will be broken down then the price action of DOT may move more down for the completion of the Butterfly move.
Click on below link, then click on VMining select your plan and start earning amazing returns with yobit exchange's VMining program