
Hey friends, I hope you're doing well. Welcome to the latest update on Hedera. In my earlier videos, I discussed how Hedera's price had reached the resistance of a down channel on the daily time frame chart. This update continues that analysis, focusing on the current price movement and a significant breakout that has occurred on a 7-day time frame chart.
Hedera's Price Rejected Again by Down Channel Resistance
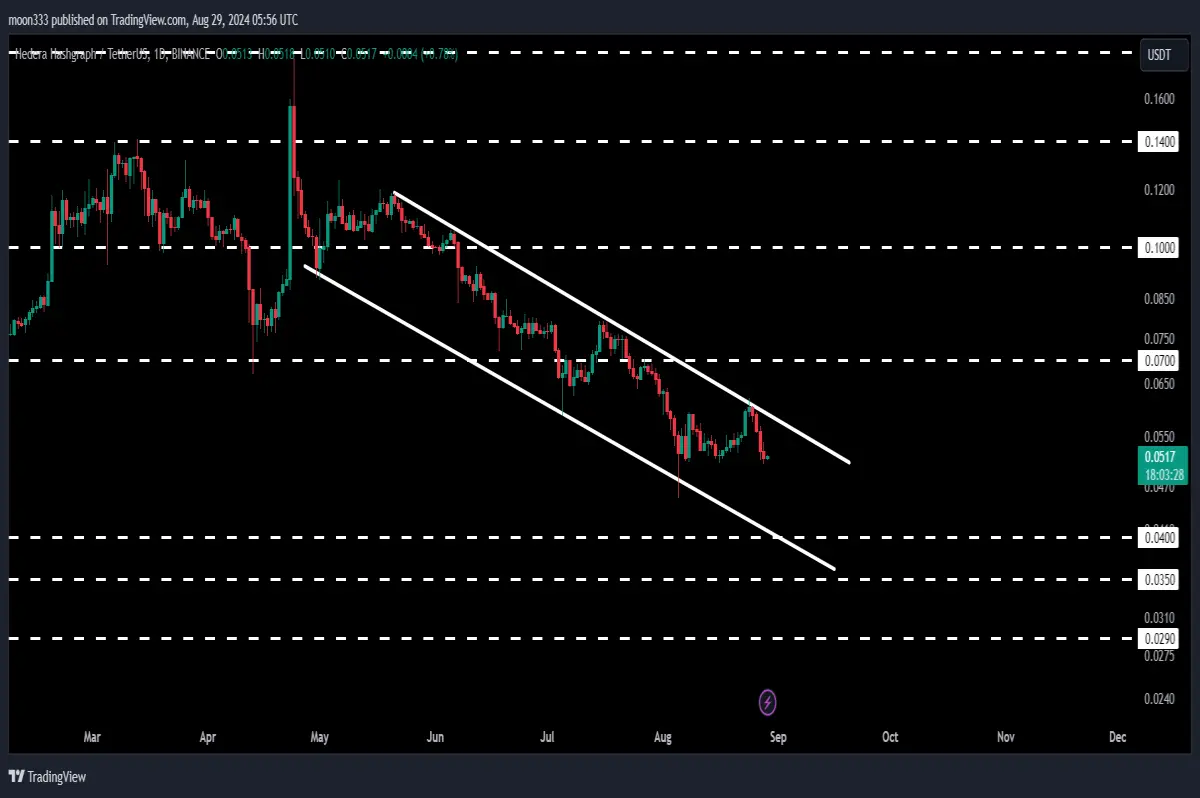
If we look at the live daily time frame chart, Hedera's price has once again been rejected by the resistance of this persistent down channel. This is not the first time the price has encountered this resistance, and the repeated rejections suggest that breaking through will be crucial for any significant upward movement.
Massive Breakout on the 7-Day Time Frame Chart
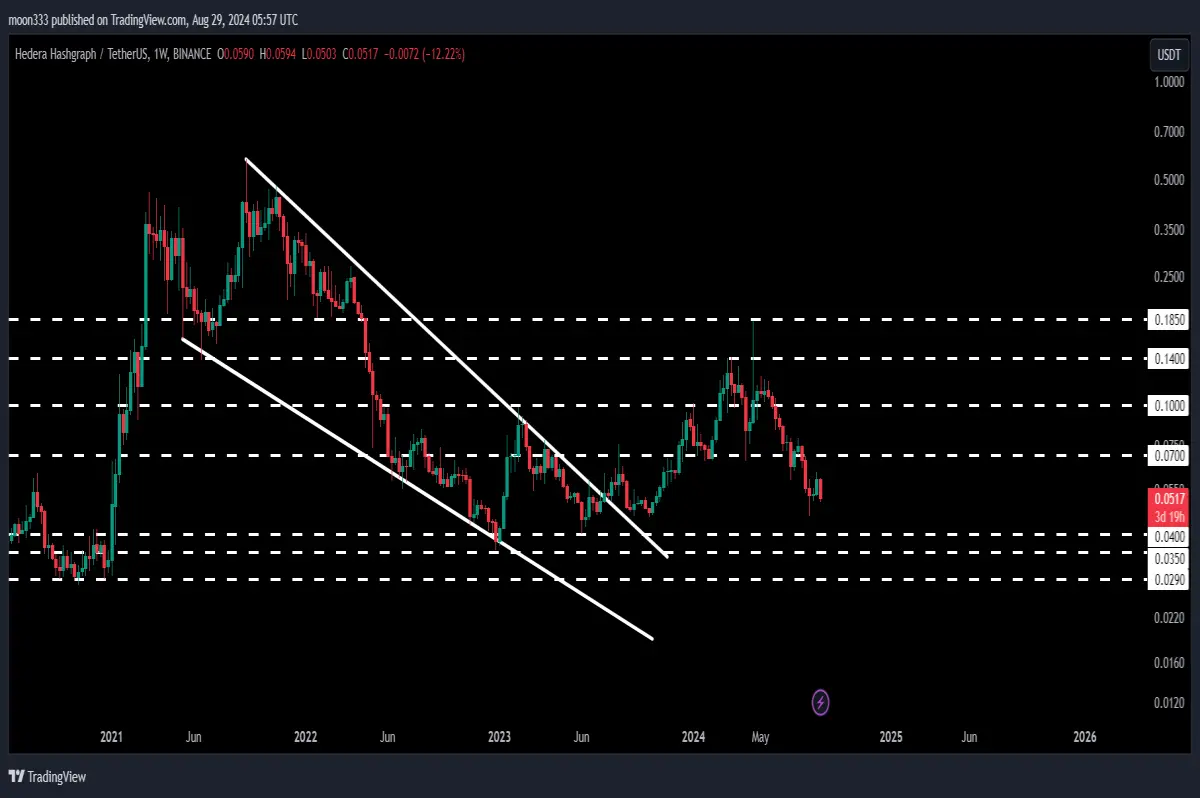
However, there's a more optimistic scenario unfolding on a larger scale. On the 7-day time frame chart, Hedera has experienced a very significant breakout from a long-term falling wedge pattern. This is a major development, as I've previously mentioned that breaking out of this pattern could lead to a massive rally.
So far, from the last time Hedera tested the support of this wedge up to its recent high, the price has surged almost 354%. In today's update, we will dive deeper into the implications of this breakout and what it could mean for Hedera's future price action.
Potential Targets and Key Levels to Watch
Let's start by revisiting the daily time frame chart. Since April 30, 2024, Hedera's price has been moving within this down channel, encountering multiple bounces and rejections along the way. The most recent rejection occurred after a bounce on August 5, 2024, and now the price is once again testing the resistance.
For Hedera to initiate a significant upward move, it must break out of this down channel. Failing to do so could result in the price testing the support of the channel around 4 cents. However, if a breakout does occur, the technical target to the upside would be approximately 11.7 to 12 cents.
On the weekly time frame, the situation looks even more promising. Hedera has already broken out of a long-term falling wedge pattern, but the price was rejected at the 18.5 cent resistance level. This level had previously acted as strong support for several weeks before flipping into resistance after the breakdown.
To continue the rally that began after the breakout from the falling wedge, Hedera must overcome this 18.5 cent resistance. The long-term technical target for this breakout is at the top of the wedge, which is around 60 cents.
Conclusion
In conclusion, while Hedera's price is currently facing resistance within a down channel on the daily time frame, the massive breakout on the weekly time frame chart from a long-term falling wedge pattern offers hope for a significant rally. To continue this upward movement, Hedera must break through key resistance levels, with potential targets as high as 60 cents.
If you found this analysis helpful, please hit the like button and subscribe to the channel. For more trading signals and updates, you can join me as a YouTube or Patreon member. Links are available below.






