Hey friends, hope you're well! In today’s update, we’ll take a detailed look at GALA's price action. Over the past several months, GALA has broken out of multiple down channels and formed bullish patterns that suggest a potential breakout. Let’s analyze the charts and see where GALA might be headed next.
Breaking Out of Long-Term Down Channels
On the 7-day time frame chart, GALA has made significant moves. First, it broke out of a long-term down channel, resulting in a short pump. Afterward, GALA entered another down channel that lasted from January 2023 until October 2023, and once again, it broke out of this pattern.
- Target Achievement: The breakout from the second down channel targeted the top of the channel, around 6.5 cents, and GALA exceeded that, experiencing a massive 584% pump.
- However, the price couldn’t break the critical resistance of 7.5 cents, which has become a key barrier after serving as support in the past.
![BINANCE:GALAUSD Chart Image by moon333]()

Current Bullish Biased Pattern in Formation
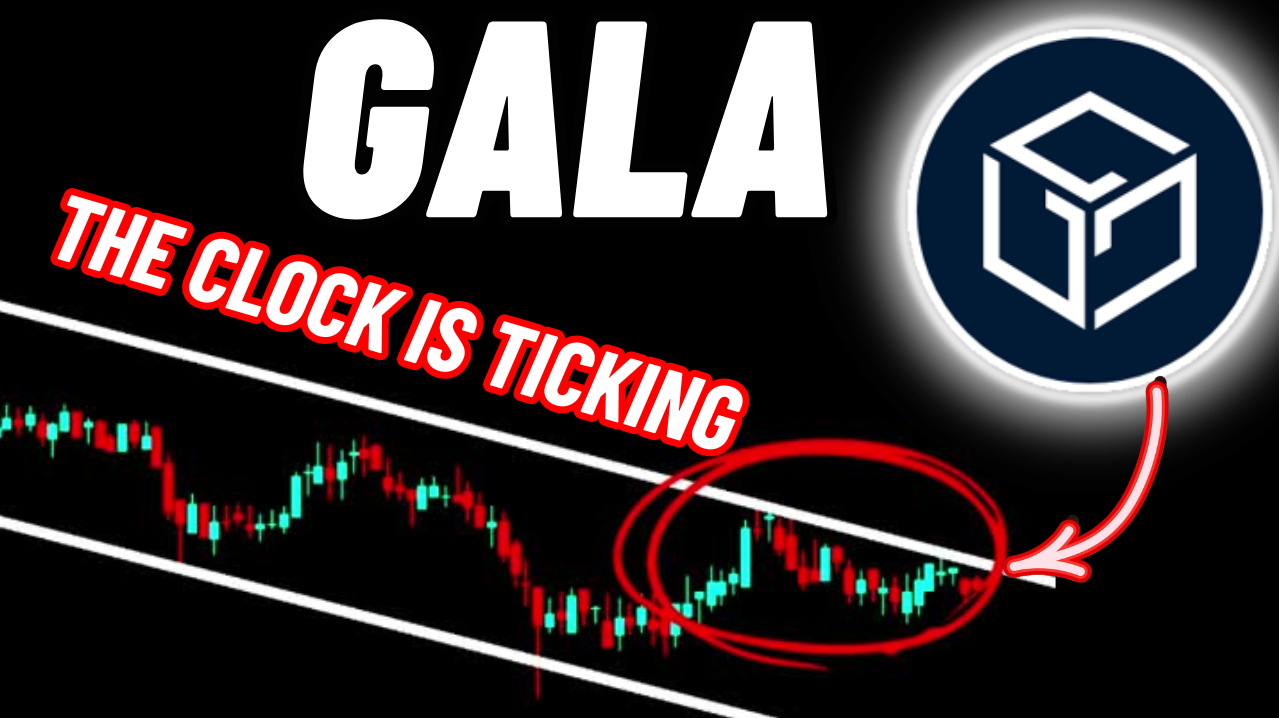
GALA has now entered another bullish biased pattern, forming a new down channel. When we look at the daily time frame chart, we can see that since March 2024, GALA has been moving within this down channel. Despite multiple rejections from the channel’s resistance, the price remains in a bullish formation.
- Channel Rejection: GALA has been rejected several times from both the channel resistance and a long-term resistance at 2 cents, which previously acted as support.
![BINANCE:GALAUSD Chart Image by moon333]()

Key Levels to Watch
- Support Level: In case of another rejection, GALA could potentially test the support of the channel, located around $0.009 to $0.01.
- Resistance Level: If GALA breaks out of the channel, the technical target would be the top of the channel at around $0.088. This breakout would also position GALA to challenge the 7.5 cent resistance once again, which has acted as a crucial level in the past.
Long-Term Targets for GALA
Looking at the bigger picture, the breakout from the initial large down channel gives us a long-term price target. If GALA can continue its bullish trajectory and break through the resistance levels, the long-term target could be somewhere between 90 cents to $1.
Conclusion
In conclusion, GALA has shown strong bullish potential by breaking out of multiple down channels and forming a new bullish pattern. However, it still faces significant resistance levels at 2 cents and 7.5 cents. If it manages to break these levels, GALA could target $0.088 cents in the short term, with long-term potential reaching up to $1.
I hope you found this analysis helpful! For more trading signals, feel free to join me as a YouTube or Patreon member. Links are available as below.