
Introduction
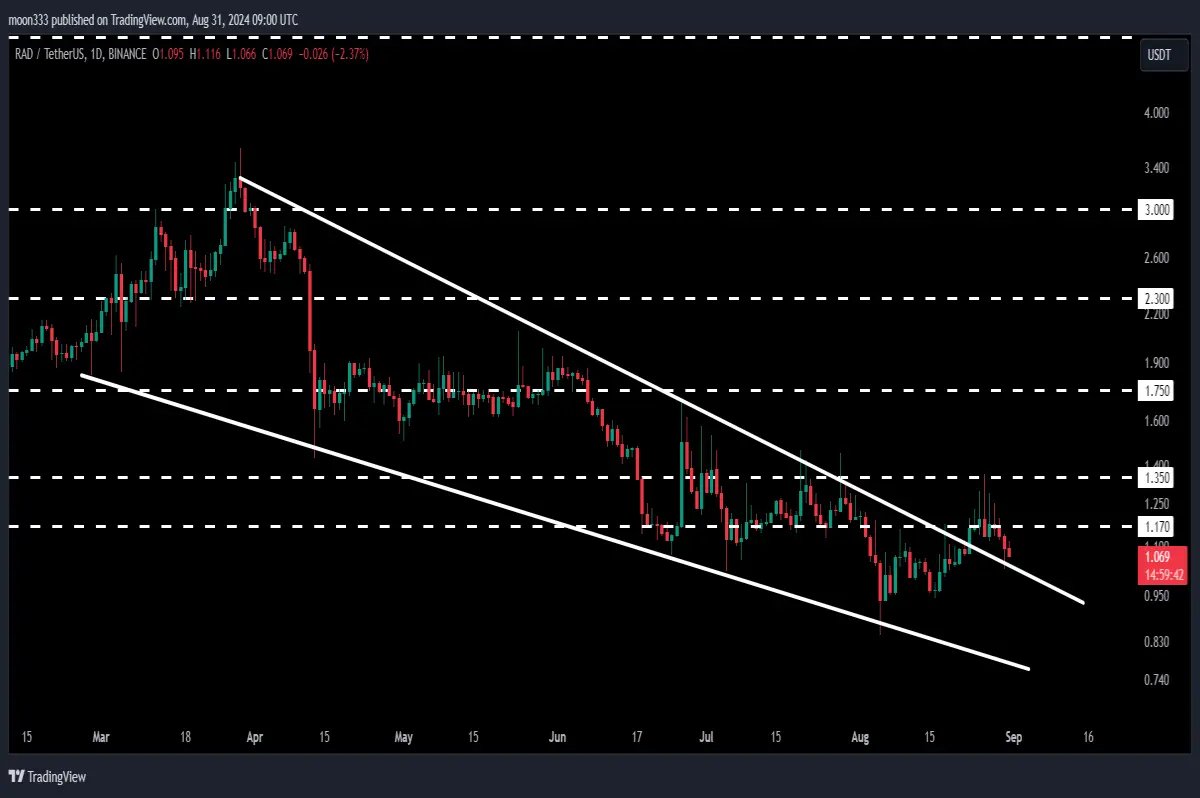
In this update, we’ll take a closer look at Radworks and its recent price movements. In previous analyses, I discussed the potential breakout from a falling wedge pattern on the daily time frame chart. Now, the breakout has occurred, and the price is accumulating above the resistance level of this wedge. However, the journey is far from over, as new challenges have emerged.
Recent Trade Signal: Harmonic Bullish Reversal Setup
Recently, I shared a trade signal with my members based on a harmonic bullish reversal setup—a bullish BAT pattern—on the 1-hour time frame chart. The price moved nicely from the buying zone and reached the sell target zone, resulting in a nearly 20% pump. This successful trade highlights the potential for short-term gains in RAD.
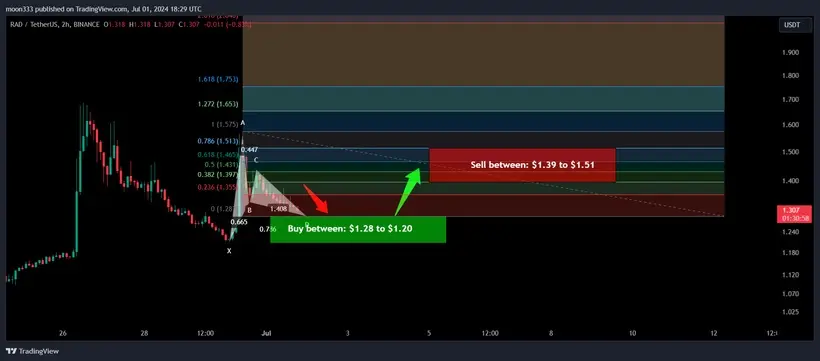
Click here to visit this trade setup
Breakout from the Falling Wedge Pattern
After struggling for some time, Radworks has successfully broken out of the falling wedge pattern on the daily chart. This breakout is a significant development, as it often signals a potential reversal in the market trend. The price is currently consolidating above the wedge's resistance, indicating that buyers are stepping in to support the move.
New Downtrend Line Resistance
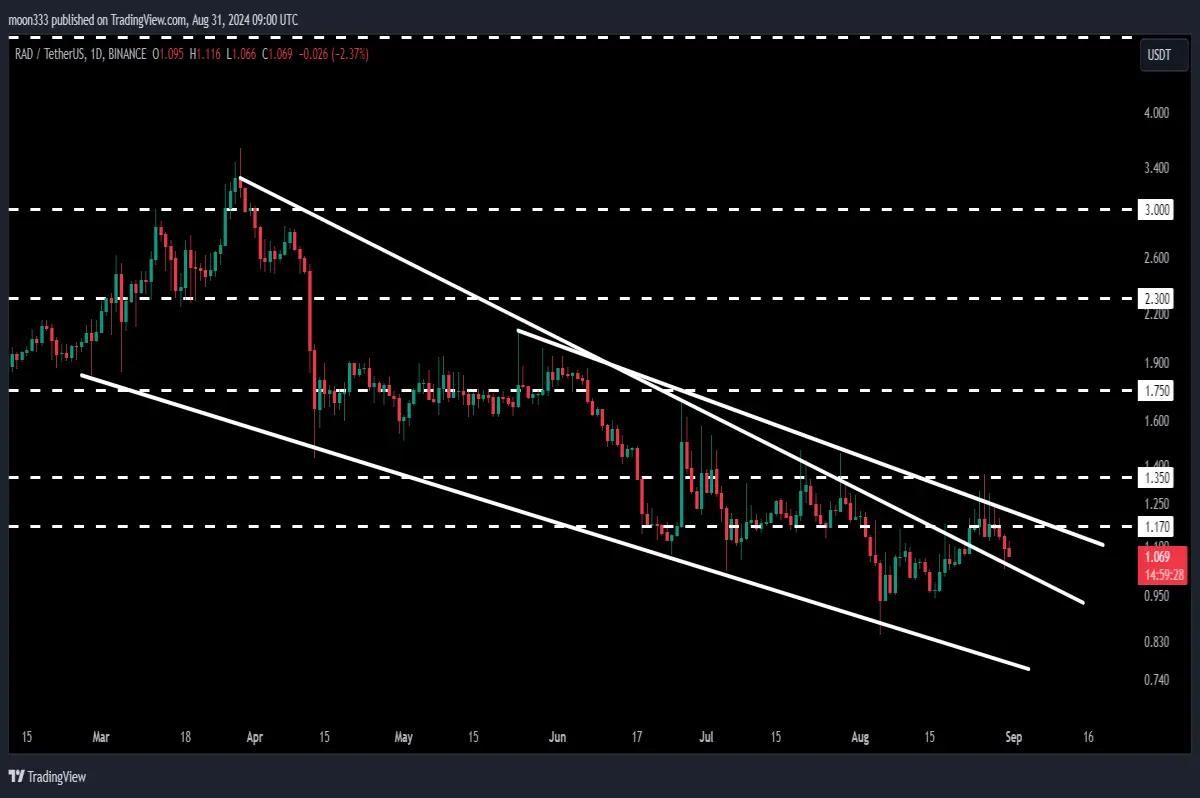
Despite the breakout, Radworks has encountered a new challenge—a downtrend line resistance. The price has faced multiple rejections at this resistance, making it a critical level to watch. Additionally, the price is also struggling to break through the long-term resistance at $1.17, further complicating the bullish outlook.
Long-Term Perspective: 7-Day Time Frame Analysis
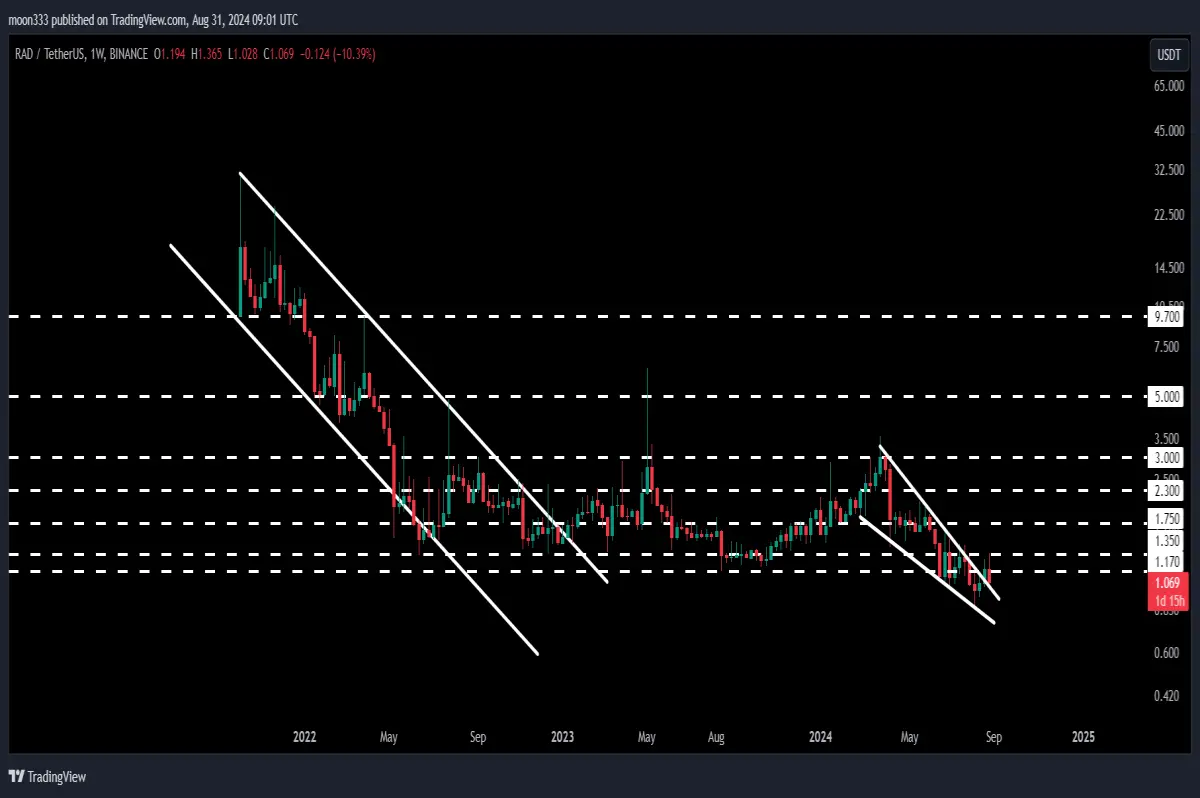
Looking at the 7-day time frame chart, RAD previously experienced a significant breakout from a long-term down channel. This breakout led to a short rally, where the price surged by more than 364%. However, the price was rejected at the long-term resistance level of $5. Now, the price is trapped inside another falling wedge pattern, but a recent breakout has provided some hope for bulls.
Key Levels to Watch
To continue the upward momentum, Radworks needs to overcome several key resistance levels:
- Downtrend Line Resistance: Multiple rejections indicate strong selling pressure.
- $1.17 Long-Term Resistance: A crucial level that needs to be broken for a sustained rally.
- $1.35 Resistance on the 7-Day Chart: Breaking this level could lead to a retest of the previous high at $3.27.
Conclusion: What's Next for Radworks?
While the breakout from the falling wedge pattern is promising, RAD faces significant resistance levels that it must overcome to continue its upward trajectory. If the price manages to break through these levels, we could see a retest of the previous highs, offering substantial upside potential.
For more in-depth analysis and real-time trading signals, consider joining my membership. Together, we can navigate the complexities of the market and capitalize on potential opportunities.






