
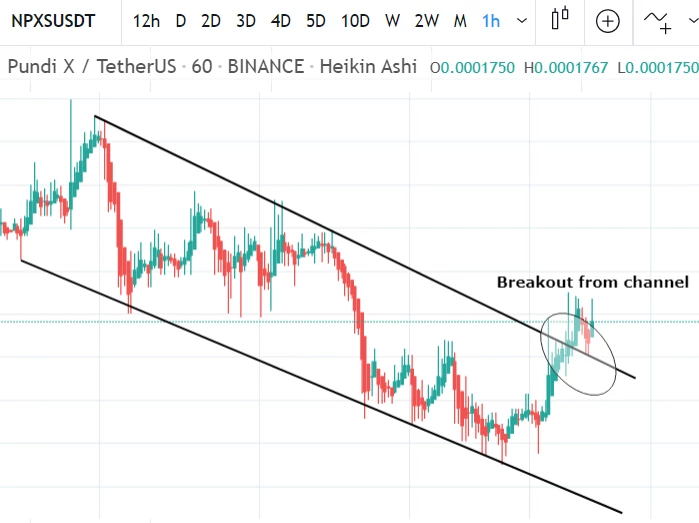
Since 10 Nov the price action of Pundi X was moving in down channel after 4th hit at channel’s support finally the priceline has broken out the resistance of the channel on 1hr time period chart.
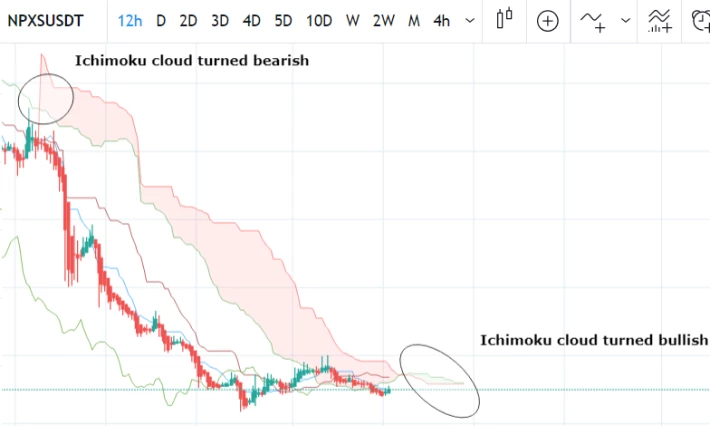
On 12hr time period chart the Ichimoku cloud was bearish since 20 Sep and finally it has turned bullish indicating a strong bull rally soon.
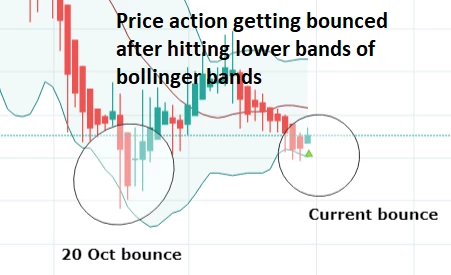
On day chart the price line is getting bounced after hitting the support or lower bands of bollinger bands.
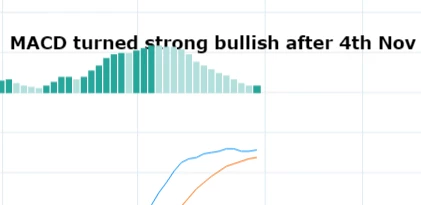
moreover after hitting on this support the MACD is turned strong bullish.
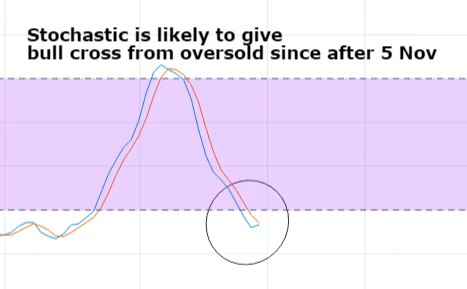
And Stochastic is likely to give bull cross from the deep of oversold zone very soon.
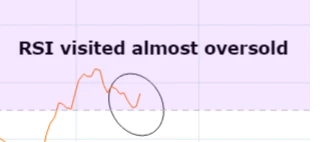
RSI has almost visited the oversold zone with value of 31 and now turning bullish.
Now finally on the same day chart the price action has completed the formation of bullish Cypher lets have a look how perfect this pattern is:
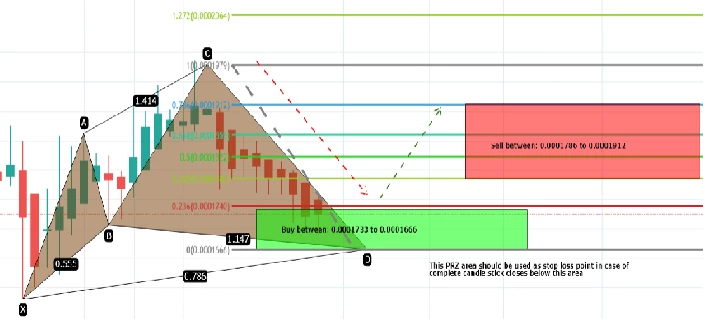
1. After initial let the A to B leg is retraced between 0.382 to 0.618 Fibonacci.
2. The B to C leg is projected between 1.272 to 1.414 Fibonacci projection of initial A to X leg.
3. The final C to D leg is retraced between 0.618 to 0.786 of X to C leg.
Above all Fibonacci retracements and projections are perfect as required for the Cypher pattern which indicates that at this time on day chart we are in potential bullish reversal zone.
Now if the price action crosses up the 0.786 Fibonacci projection of of C to D leg and a complete candle stick closes above this level then a more powerful bull rally can begin than the previous one how ever for secure trade we can sell between 0.382 to 0.786 Fibonacci projection of C to D leg and the targets can be as below:
Buy between: 0.0001733 to 0.0001666
Sell between: 0.0001786 to 0.0001912
Regards,
Atif Akbar (moon333)






