
Introduction
Hey friends, this is Atif Akbar, and welcome to the new update on Bitcoin. In my previous article, I showed you the recent price movements and the technical indicators suggesting a potential reversal. Let's dive into the latest developments and what they mean for Bitcoin's price action.
Bullish Divergence and Price Reversal
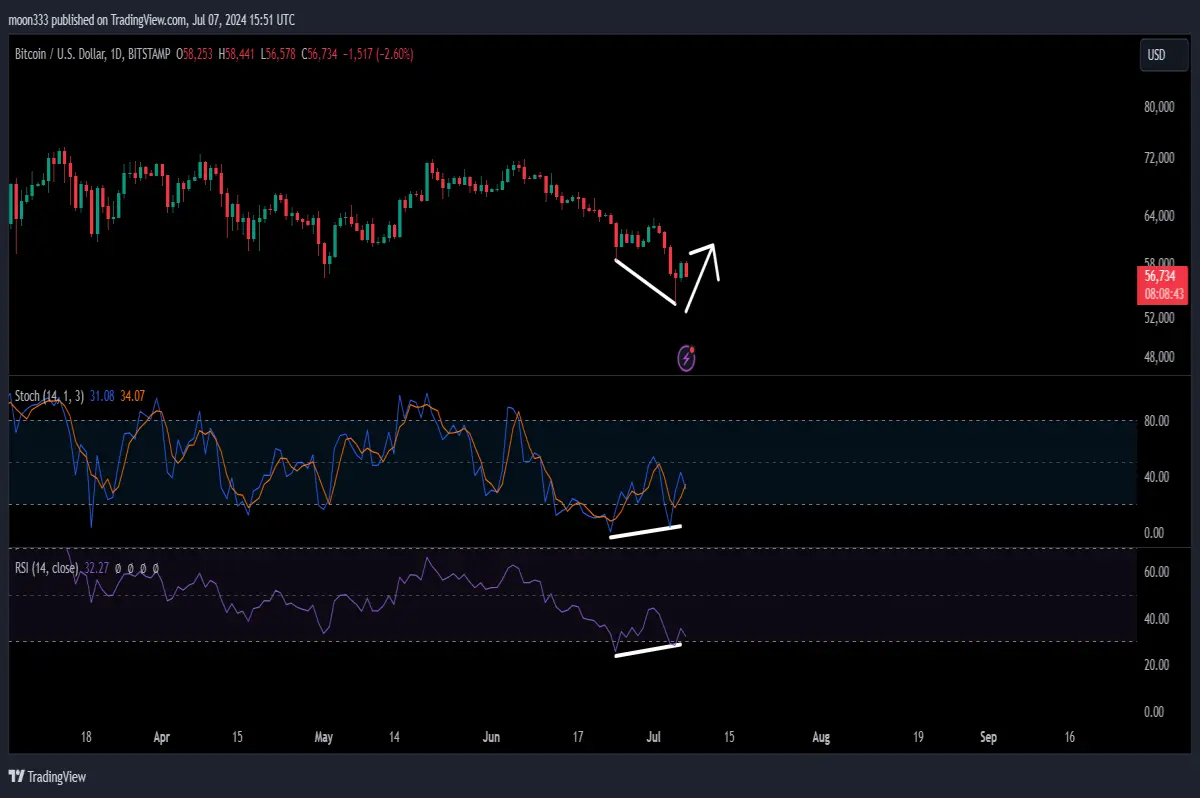
Despite the recent sell-off, a double bullish divergence appeared on the chart. The price line was forming lower lows while the RSI and stochastic oscillators were forming higher lows. This indicated a potential reversal, which we are now witnessing as the price has moved above the support level of $56,500, the lowest price of May 2024.
Recent Recovery and Resistance Levels
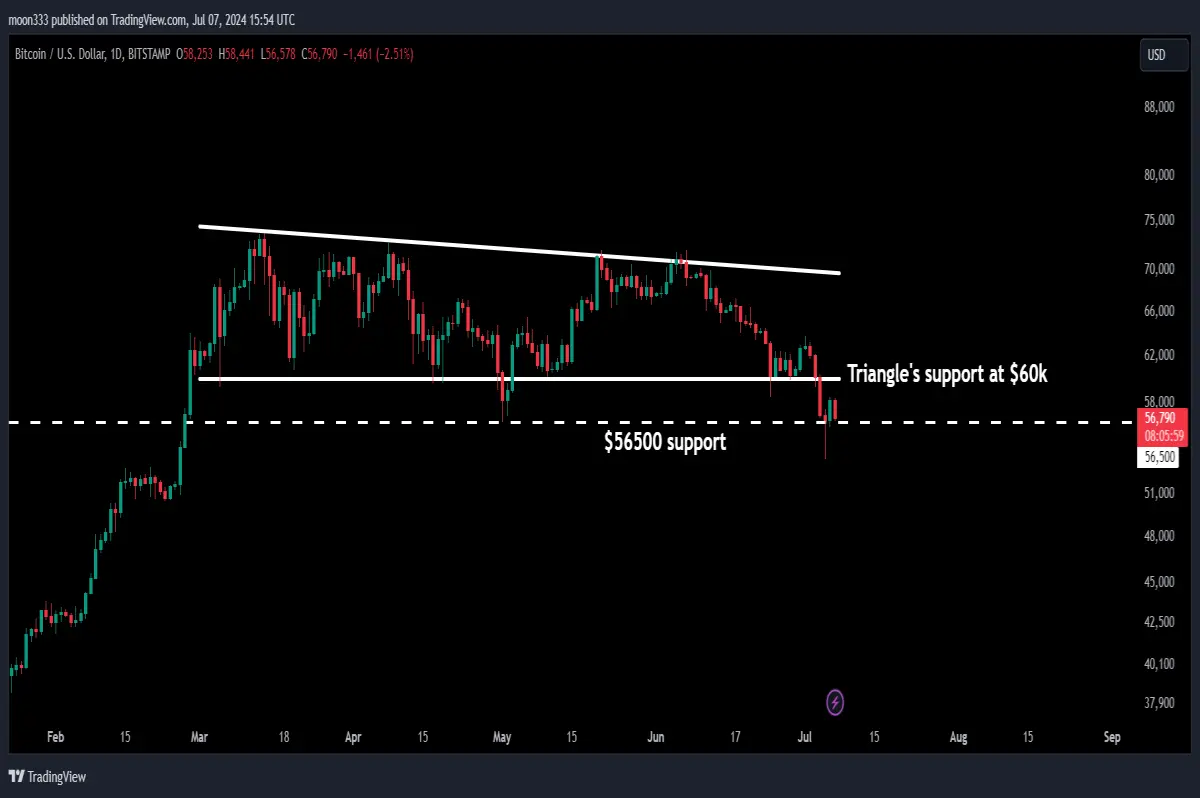
Bitcoin has recovered by almost 9-10% from its recent low. However, it faces resistance at the $60,000 mark, previously a support level in a descending triangle pattern. This resistance needs to be broken for further upward movement.
For detailed analysis you can also watch the below video from my YouTube channel:
Support and Resistance Zones
Bitcoin is currently in a strong support zone between $56,500 and $60,000. A daily close below $56,500 could lead to a drop towards the next significant support at $49,000, which has historically acted as both resistance and support.
Weekly Time Frame and Up Channel
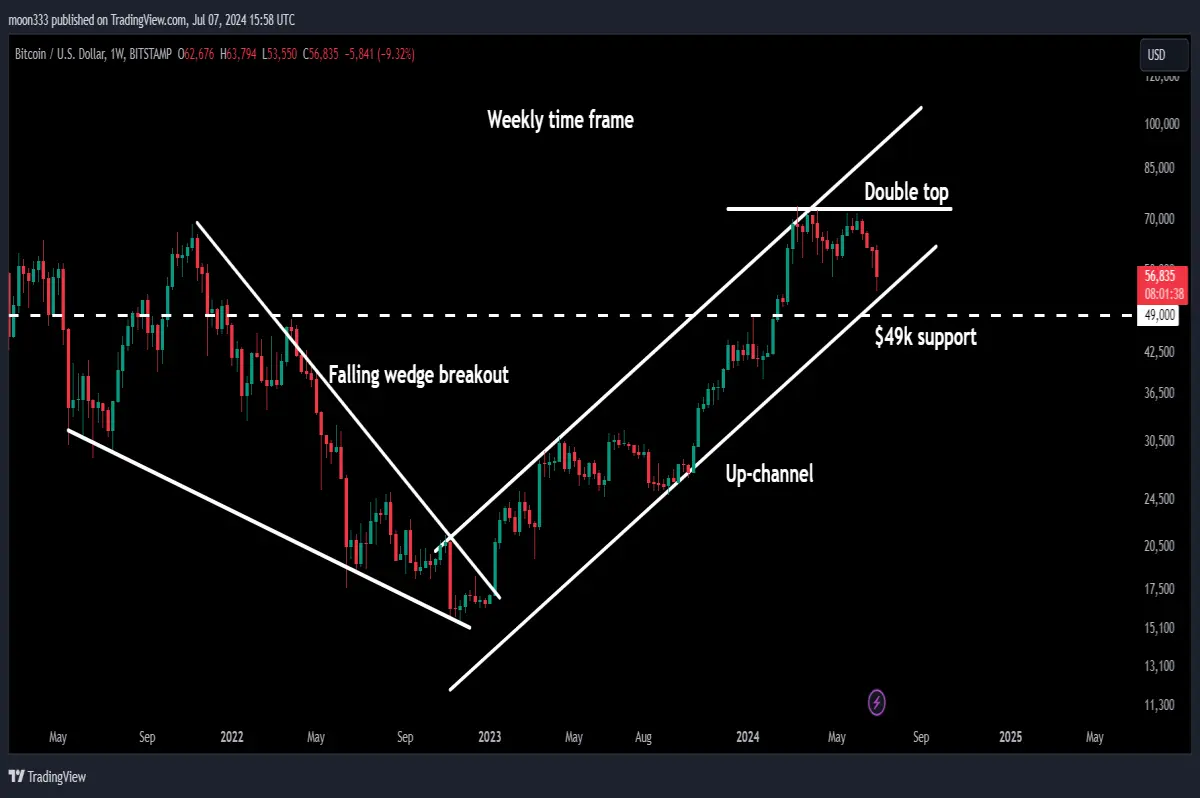
On the weekly time frame, Bitcoin has broken out of a massive falling wedge pattern. The technical target for this breakout is $70,000. The price has surpassed this target but now faces a double top around $73,000. If it breaks this resistance, it could reach the channel's resistance at approximately $100,000.
Conclusion and Future Outlook
Bitcoin's price movement is currently confined within crucial support and resistance levels. Breaking above $60,000 and subsequently $73,000 could lead to significant gains. Conversely, a drop below $56,500 might push the price towards $49,000. Keep an eye on these levels for future price action.
For more detailed analysis and trading signals, you can join me as a YouTube or Patreon member. Links are as below:






