
Hey friends, hope you are well, and welcome to the latest update on Book of Meme. In this article, we will explore the current price action, the formation of a diamond bottom pattern, and potential trading opportunities.
Current Price Action: Down Channel Overview
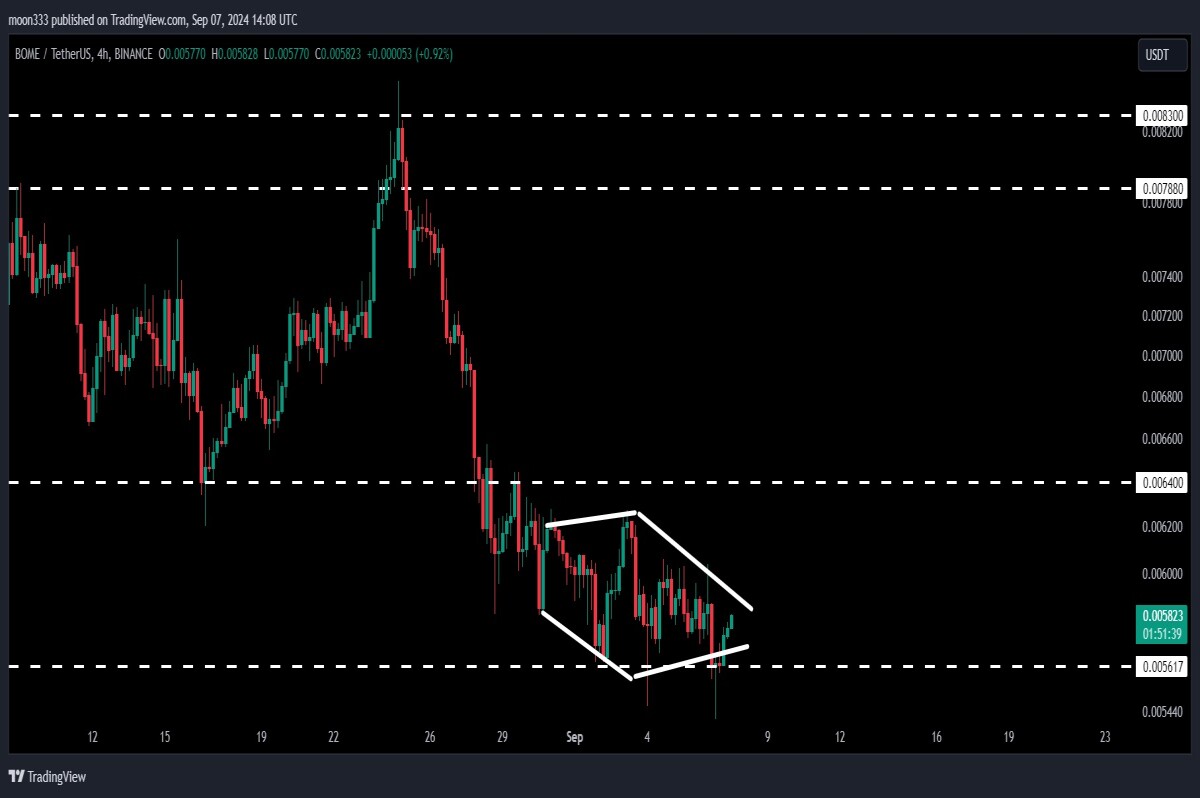
Book of Meme has been moving within a long-term down channel for some time now. The price has been consolidating in the support zone, which starts from $0.006400 and goes down to $0.005600 Over the past few days, the price has shown accumulation at this support level.
Adjusting the lower bands of this support reveals a new support level approximately around $0.00000056, which has acted as a significant support point in the past. The price has previously found support at this level multiple times, indicating its strength.

Formation of a Diamond Bottom Pattern
On the 4-hour timeframe chart, we observe the formation of a diamond bottom pattern. While it may not be a perfect formation, it indicates a potential price reversal. The pattern features clear resistance and support levels, suggesting a bullish reversal could be on the horizon.
The diamond bottom is characterized by its potential to signal a price reversion, and if confirmed, it could lead to an upward movement from the current price levels.
Analyzing the Live Chart
Now, let's take a look at the live chart of Book of Meme on the 4-hour timeframe. Following a recent drop, the price formed the aforementioned diamond bottom pattern. This pattern suggests that once the price breaks above the resistance of this formation, we could see a trend reversal to bullish.
The key resistance to watch is around $0.00000064, which has been a significant barrier in the past. If the price manages to break this resistance, it could lead to further upward movement toward the resistance of the channel.
Key Resistance Levels and Future Targets
Examining the daily timeframe chart, the resistance level at $0.00000064 has been a strong support and resistance zone historically. If the price breaks above this level, it will likely face additional resistance around $0.000000778 to $0.00000083. This area has also acted as both support and resistance in the past.
Should the price successfully navigate through these resistance levels, it could aim for the channel's upper resistance, which is approximately $0.00000087. Beyond that, the technical target for a breakout from the channel could be around $0.02, representing a significant price movement.
Conclusion
In summary, the analysis of Book of Meme reveals a critical phase of price consolidation within a falling channel. The diamond bottom pattern suggests a potential bullish reversal, provided that key resistance levels are overcome.
Thank you for reading! If you found this analysis helpful, please hit the like button and subscribe to the channel for more updates. For additional trading signals, consider joining me on YouTube or Patreon, where I share various trading insights. You can find the link to join in the video description.
Take care, and goodbye!


