
Introduction
Welcome to the latest update on GLMR. In previous analyses, we've discussed how GLMR broke out of a long-term downtrend channel, leading to a strong rally. However, the price has encountered resistance and formed a falling wedge pattern. In this article, we will examine the current price movement within this pattern and potential future targets.
Recent Price Movement: Falling Wedge Formation
After the initial rally following the breakout from the down channel, GLMR faced rejection at a significant resistance zone. Since then, the price has been moving within a falling wedge pattern on the daily timeframe. Recently, the price attempted to break out of the wedge but was rejected by the upper resistance line, pushing the price back towards the support level of 16.2 cents.
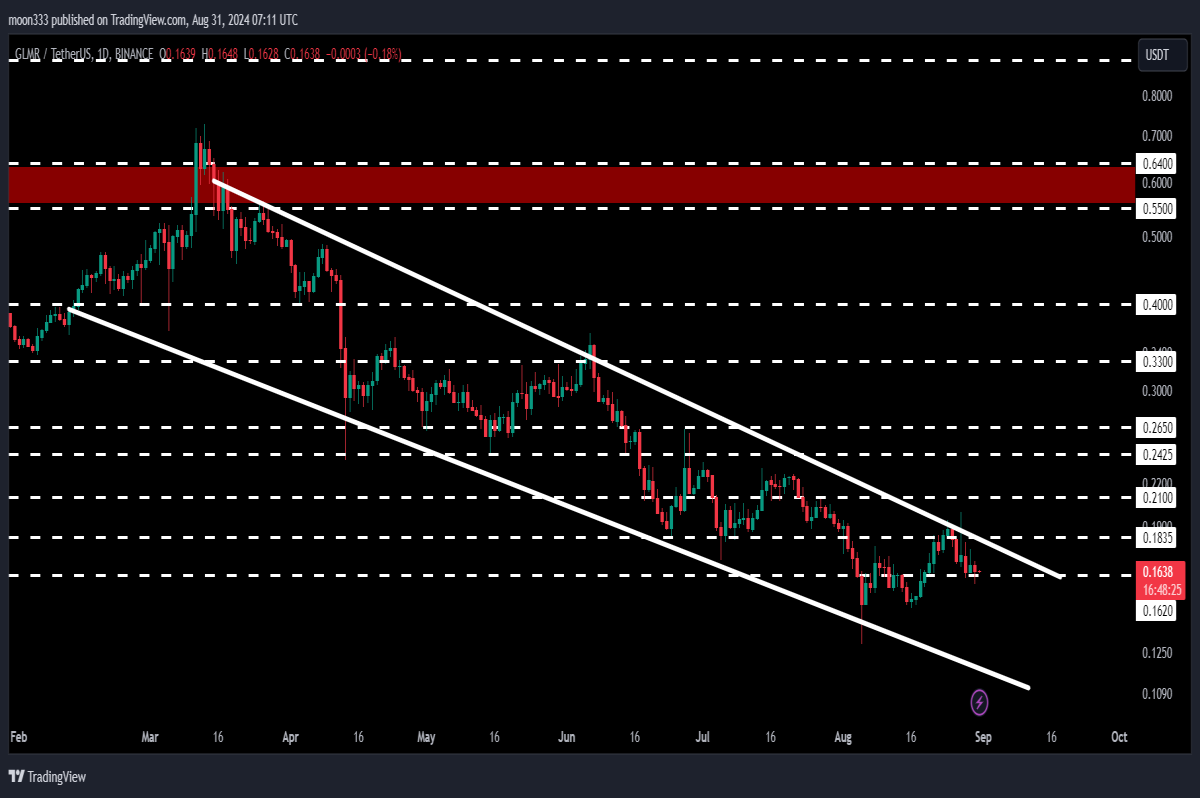
Key Support and Resistance Levels
Currently, GLMR is testing the crucial support at 16.2 cents. A breakdown of this level could lead to a decline towards the next support at approximately 11.38 cents. However, given that the falling wedge is a bullish pattern, there is a higher probability of a breakout to the upside. If this occurs, the technical target would be around 55 cents, which coincides with a long-term resistance zone between 55 cents and 64 cents.
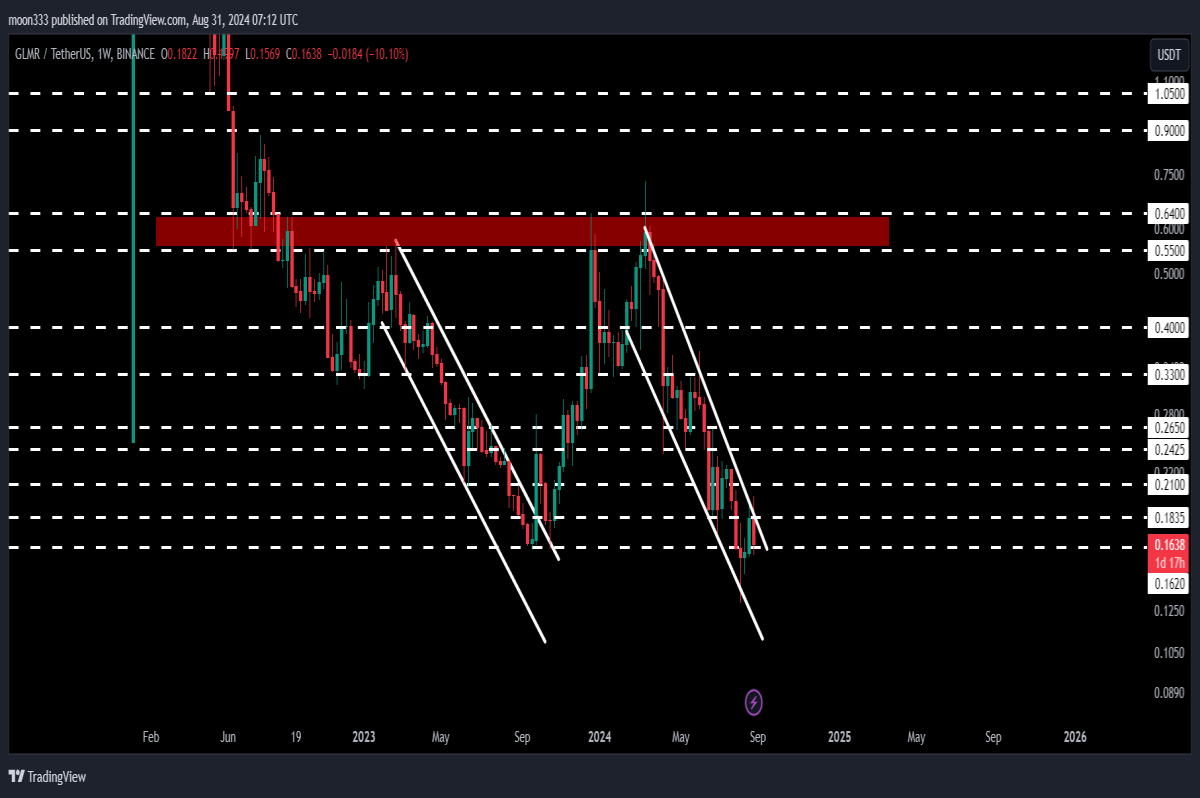
Long-Term Outlook: 7-Day Timeframe Analysis
On the 7-day timeframe, GLMR had previously broken out of a long-term down channel, which we discussed in earlier analyses. The target for this breakout was around 60 cents, and the price indeed rallied beyond that target, only to be rejected by the strong resistance zone starting from 55 cents and extending to 64 cents.
This resistance zone has been a significant barrier since August 2022, flipping from support to a formidable resistance. Multiple rejection points within this zone underscore its importance. For GLMR to initiate a sustained upward move, it will need to break above this resistance zone. Successfully doing so could flip this area into a long-term support zone, potentially leading to a massive rally.
Conclusion
GLMR is currently at a critical juncture, trading within a falling wedge pattern and facing significant resistance. A breakout from this pattern, coupled with a successful breach of the 55 to 64 cents resistance zone, could trigger a substantial price increase. Traders should watch these key levels closely for signs of a breakout or further rejection.
For more trading signals and updates, you can support the channel on YouTube or Patreon. Stay tuned for more in-depth analysis and trading insights.


