
Introduction
In this update, we'll analyze the recent price movements of Measurable Data Token (MDT). The cryptocurrency has recently broken out of significant technical patterns, including a large falling wedge on the 7-day time frame and another on the daily chart. Despite the bullish breakouts, MDT faces key resistance levels that could determine its next move. Let's dive into the details.
Major Breakout from the Falling Wedge
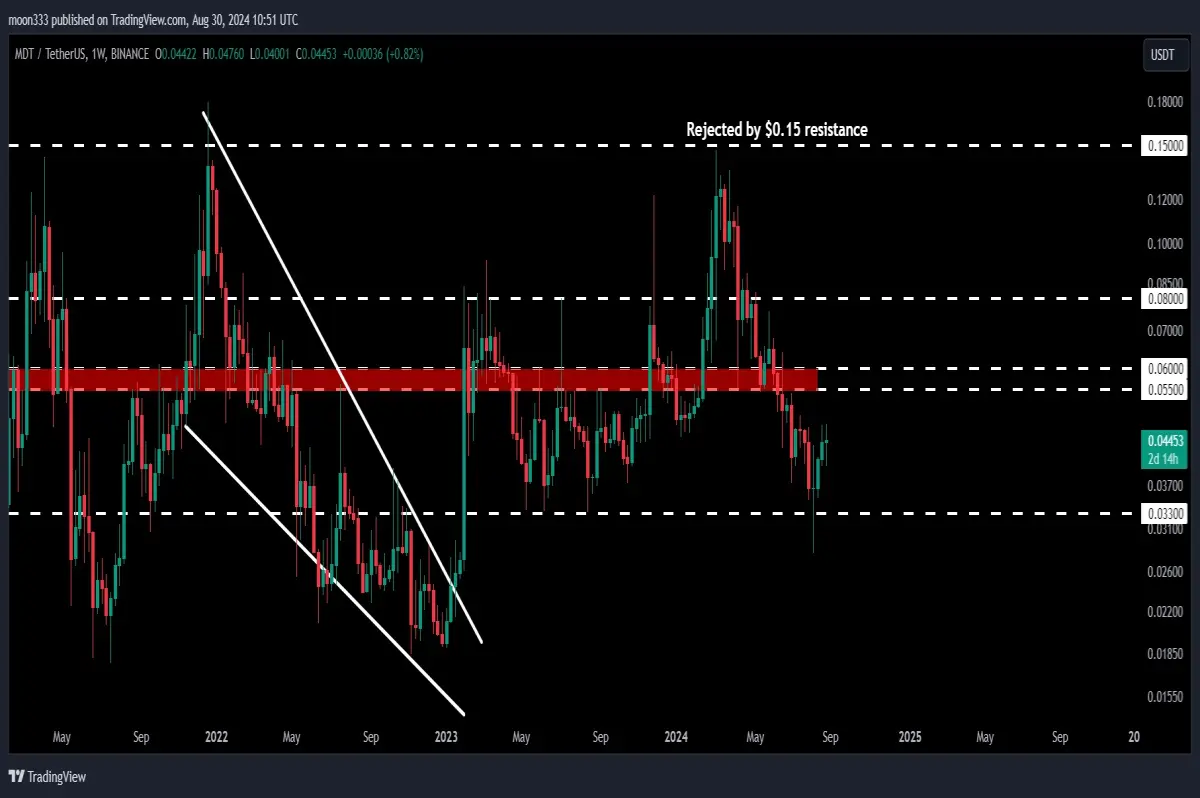
Previously, MDT successfully broke out of a massive falling wedge pattern on the 7-day time frame chart. This breakout led to a substantial rally, with the price reaching the technical target of the wedge, estimated to be between $0.15 and $0.20. The $0.15 level, in particular, has been a strong resistance point historically, having acted as resistance multiple times in the past.
As expected, MDT reached this target but was once again rejected at the $0.15 resistance level. The inability to break through this level indicates that it remains a significant barrier for further upward movement.
Recent Breakout on the Daily Time Frame
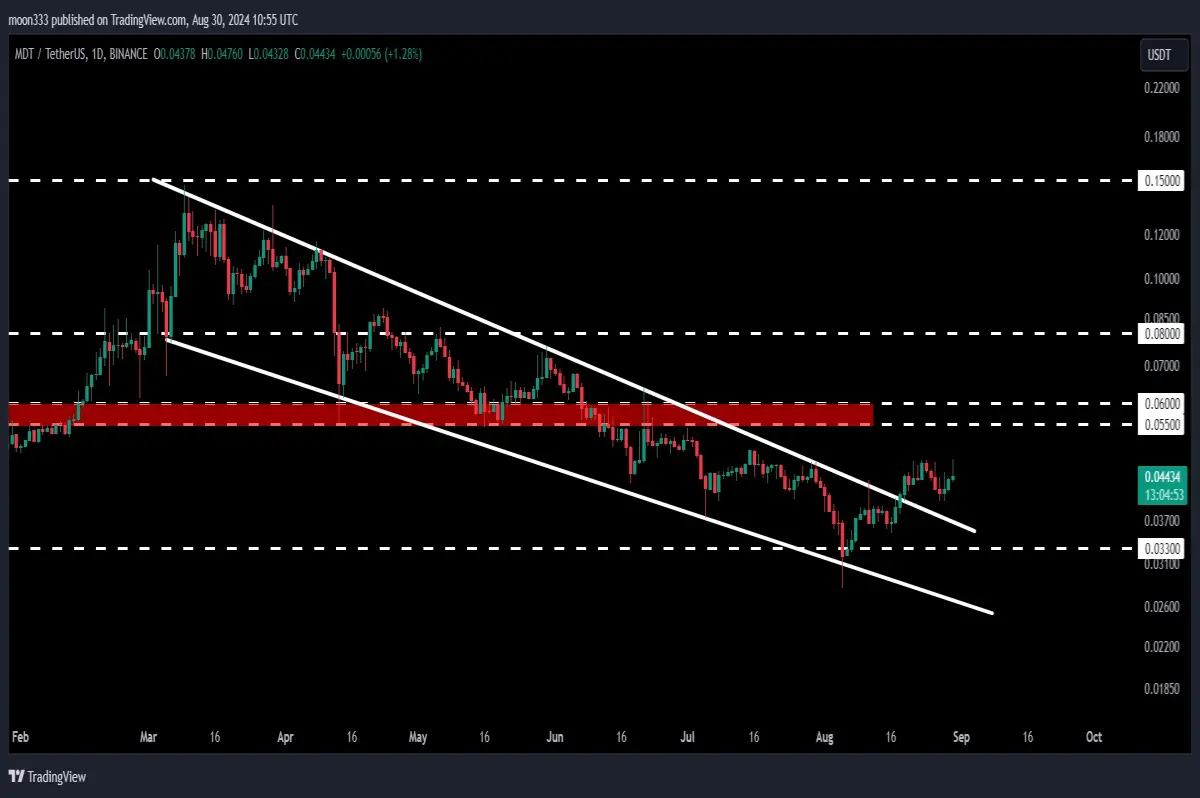
More recently, MDT has broken out of another falling wedge pattern, this time on the daily time frame chart. Since this breakout, the price has been consolidating above the wedge's previous resistance, which now serves as a support level. Although MDT has yet to retest this support, the price appears to be gearing up for another attempt at breaking through the resistance.
If the price revisits and successfully tests the support, it could provide a solid foundation for another rally. The technical target for this breakout is the top of the wedge, which aligns once again with the $0.15 level.
Key Resistance at $0.15
The $0.15 resistance level is crucial for MDT's continued bullish momentum. Having been rejected at this level after the initial rally, MDT needs to break through this resistance to aim for higher targets, potentially reaching up to $0.20 as indicated by the initial wedge pattern.
Given the strength of this resistance, a breakout above $0.15 could signal the beginning of a more sustained upward trend for MDT. Traders should closely monitor this level for signs of either rejection or breakthrough.
Conclusion
MDT is at a pivotal point, having broken out of key technical patterns but now facing a significant resistance level at $0.15. A successful breakout above this level could lead to a continuation of the bullish trend, potentially targeting $0.20. However, failure to overcome this resistance might lead to further consolidation or a pullback. As always, traders should keep an eye on these critical levels and adjust their strategies accordingly.
For more trading signals and detailed analysis, consider subscribing to the channel or joining as a YouTube or Patreon member. Stay informed and make the most of your trading opportunities with timely updates and insights.






