
Introduction
In this article, we’ll take an in-depth look at Vite Coin (VITE), focusing on recent price movements, key breakouts, and critical resistance and support levels. VITE has been showing promising signs on both daily and 7-day time frame charts, breaking out of important patterns and challenging significant resistance levels.
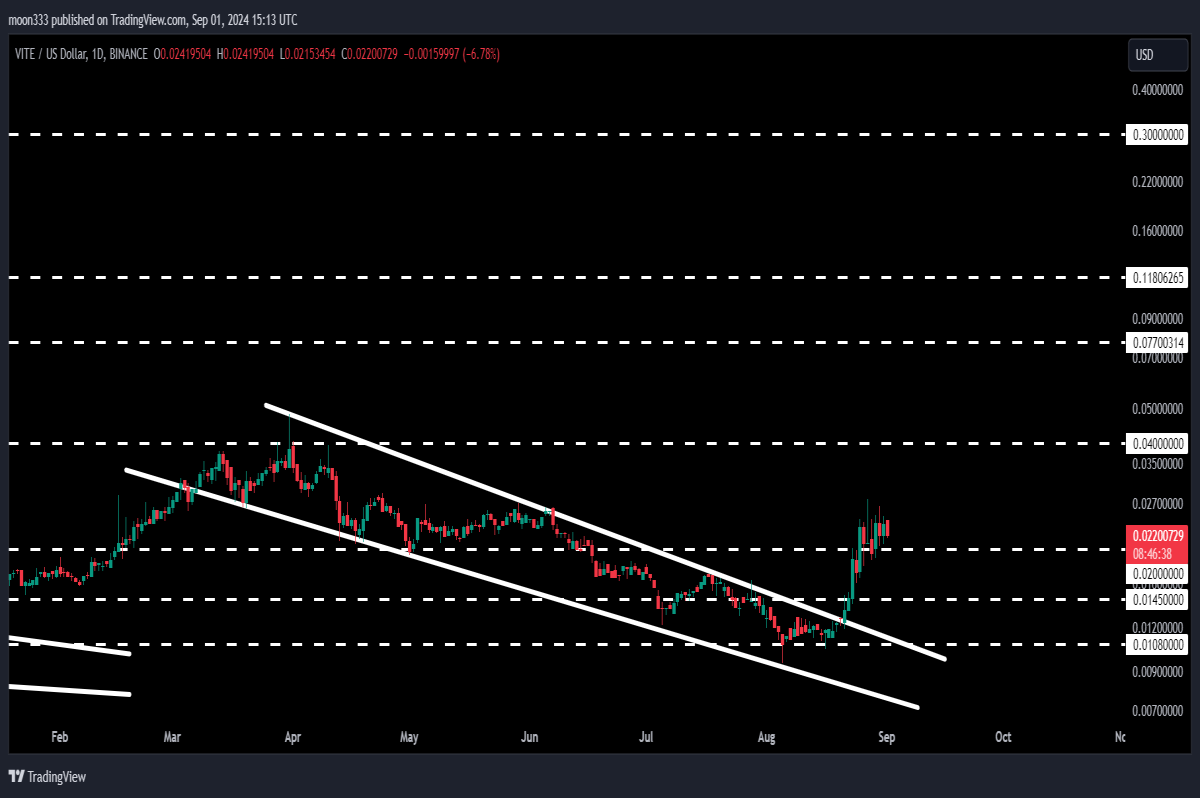
Breakout from the Falling Wedge on the Daily Time Frame
VITE recently broke out of a falling wedge pattern on the daily time frame chart. This breakout led to a substantial rally, with the price surging over 190% from its low at the support of the wedge to the recent high. During this upward movement, VITE successfully broke through a key resistance level at 1.45 cents and then continued to break above the long-term resistance at 2 cents. The price is now consolidating above the 2-cent mark, which has flipped from resistance into support.
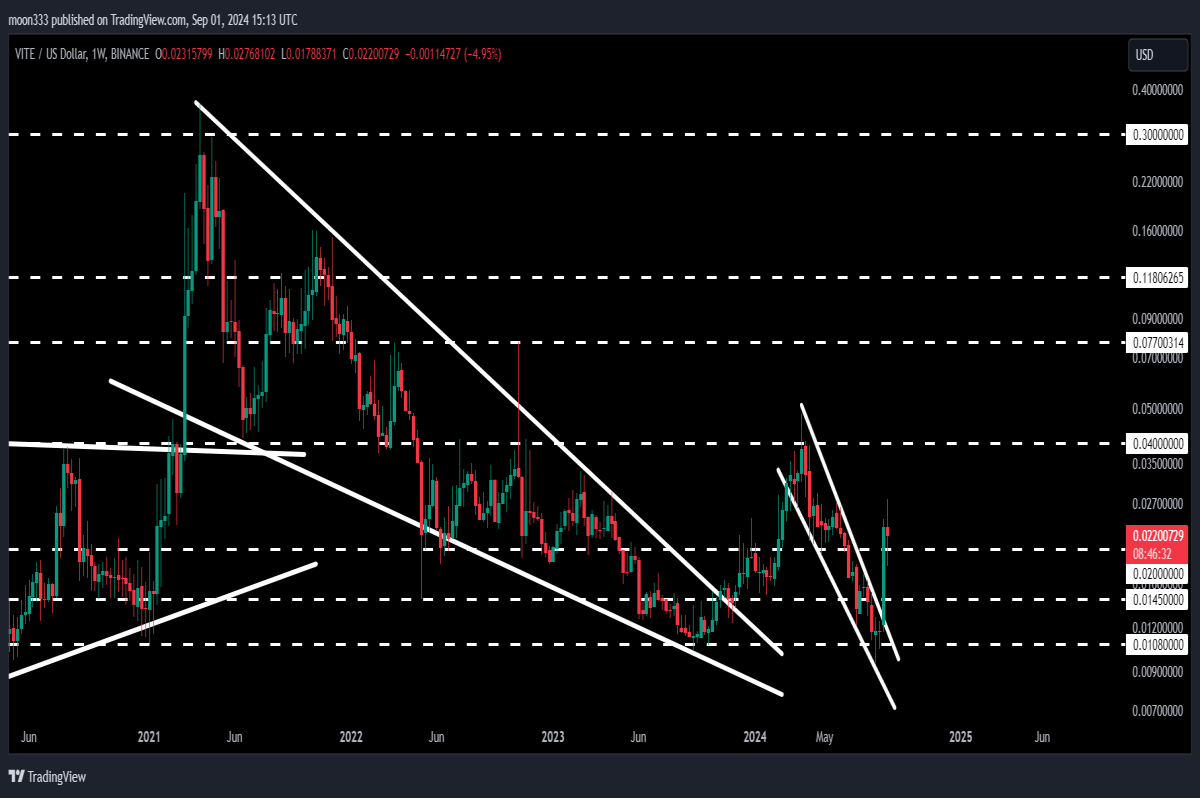
Analyzing the Long-Term Falling Wedge Breakout
Zooming out to the 7-day time frame chart, VITE has also broken out of a massive, long-term falling wedge pattern. This breakout initially triggered a strong rally, where the price increased by more than 368%. Despite this impressive performance, VITE encountered resistance at 4 cents, a level that has historically acted as both support and resistance. The price failed to break through this level, resulting in a consolidation phase.
Key Resistance Levels to Watch
The 4-cent level remains a crucial resistance that VITE needs to overcome to continue its bullish trend. If the price can break through this resistance, it could pave the way for further gains. The technical target for the breakout from the daily falling wedge is at the top of the wedge, which is approximately 4.7 to 5 cents. This target aligns closely with the next significant resistance level.
Long-Term Target After the Massive Breakout
For the larger falling wedge pattern on the 7-day chart, the technical target is much higher, ranging between 38 to 40 cents. This target represents a significant upside potential if VITE can maintain its momentum and break through the key resistance levels ahead.
Conclusion
Vite Coin (VITE) is currently showing strong bullish signs, with successful breakouts on both the daily and 7-day time frame charts. However, to sustain this upward trajectory, the price needs to clear the critical resistance at 4 cents. If it succeeds, VITE could be set for significant gains, with long-term targets reaching up to 40 cents.
Call to Action
If you enjoyed this analysis, please hit the like button and follow the blog. For more detailed trading signals and updates, consider joining as a YouTube member or Patreon member. Links for joining are as below.


