
Introduction
Welcome back! Today, we're diving into the latest developments with Alpaca Finance. In previous updates, we discussed the potential breakout of a significant falling wedge pattern on the 7-day time frame. Let’s revisit the charts and analyze the current market scenario for Alpaca Finance.
Recap of Previous Patterns
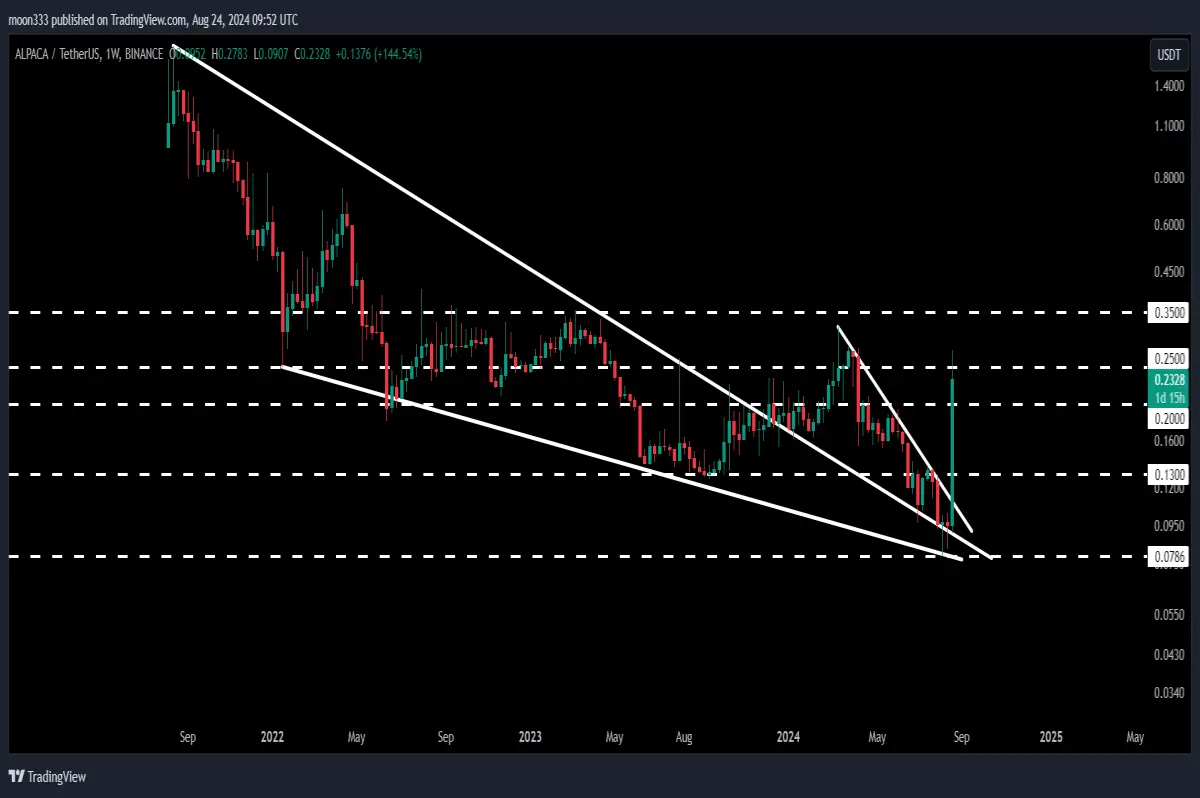
In our last analysis, we noted the formation of a large falling wedge pattern. By November 2023, Alpaca Finance broke out of this pattern, leading to a brief rally. However, the price entered another falling wedge pattern. This new wedge had the previous support of the larger falling wedge acting as support, while the new falling wedge formed its own resistance lines.
For detailed analysis, you can watch the below video:
Recent Breakout and Price Action
The price recently broke out of the smaller falling wedge pattern, resulting in a significant upward movement. Since the breakout, Alpaca Finance has surged approximately 191%, moving towards a crucial resistance level of 25 cents.
Current Chart Analysis
-
Weekly Time Frame
- Breakout Overview: On the weekly chart, the breakout from the large falling wedge occurred in December, followed by a short rally. The price then consolidated within a new wedge pattern until breaking out recently.
- Recent Movement: As of the last few days, Alpaca Finance has broken through the resistance of the smaller falling wedge pattern and is now targeting the 25 cents resistance level.
-
Daily Time Frame
- Resistance and Support: The daily chart shows that the price has recently broken out of the 20 cents resistance, moving towards the next significant resistance at 25 cents. This 25 cents level has been a strong resistance for several months but previously served as a support.
Future Targets and Predictions
-
Short-Term Targets
- Immediate Resistance: The next resistance level to watch is 25 cents. If Alpaca Finance manages to break this level, it could set the stage for further gains.
- Technical Target: The technical target for the recent breakout from the falling wedge is approximately 32 cents.
-
Long-Term Targets
- Key Resistance: The long-term resistance of 35 cents has been a strong barrier since May 2022. The price might approach this level if the current momentum continues.
- Final Target: For the larger falling wedge pattern, the final technical target is between $1.80 to $2. This level represents the top of the previous larger falling wedge and could be a significant milestone if reached.
Conclusion
The recent developments for Alpaca Finance are promising, with significant breakouts and potential for further gains. If you find these updates helpful, please hit the like button and subscribe to the channel. For more detailed trading signals and insights, consider joining as a YouTube member or Patreon supporter. Links to join and previous trading signal reports are available in the video description.






