
Hey friends hope you are well and welcome to the new update on Maker token that is one of my favorite token the 1st reason is it's volatility that I will show you on the chat later and the second reason is that they burn their tokens. For example below is a site makerburn.com
On this site you can see that they have burnet 5576 tokens so far and recently they have burnt 204 tokens on annual basis.
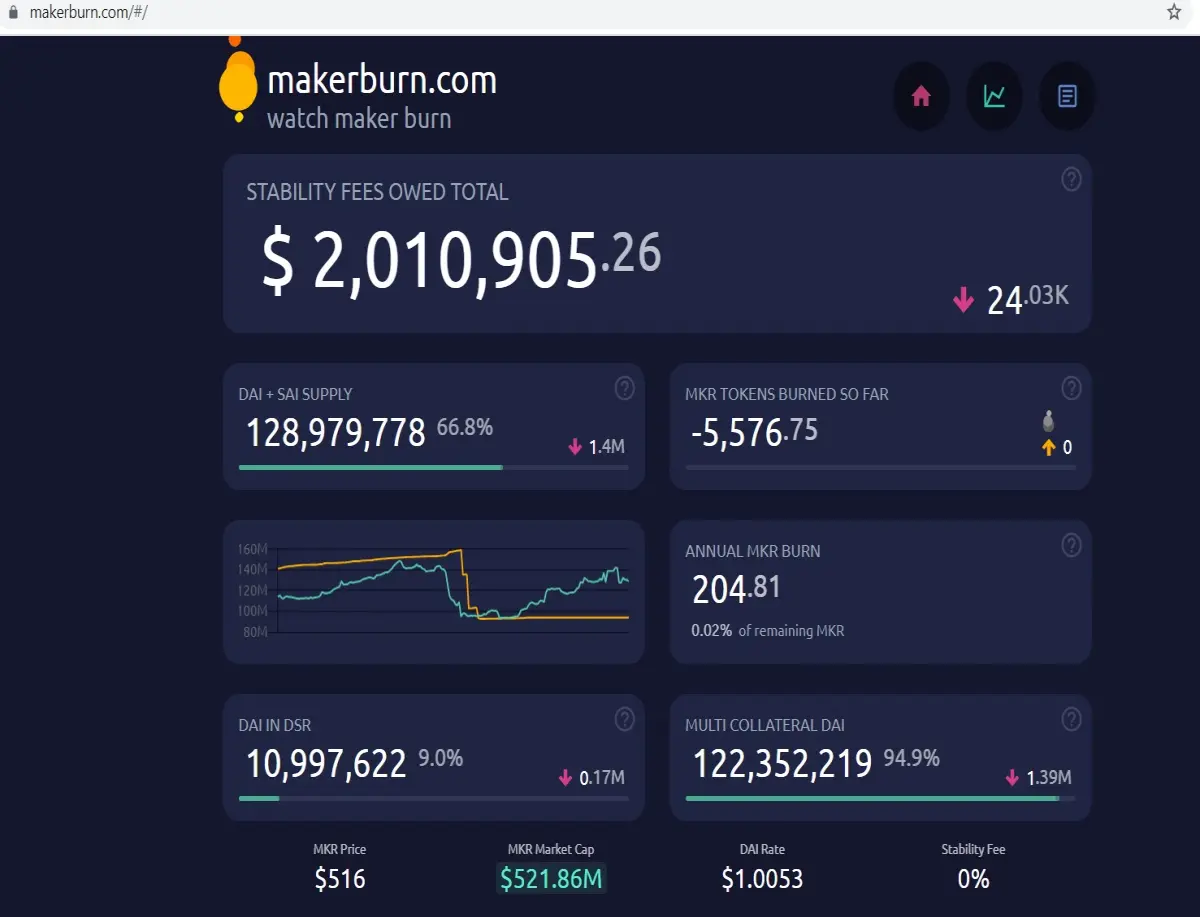
Definitely, if they are burning their token it's mean they are decreasing the supply. And this is a simple rule of supply and demand if the supply will be decreased then demand will be automatically increased and eventually the price of token will rise.
And if we visit the coinmarketcap.com then it is ranked at 23rd position out of more than 2300 cryptocurrencies and tokens that is really is very big success. And at this time it is being traded almost at $515. And if we open the historical data from coinmarketcap then we can see that over the last month the market cap of Maker token is increased by more than 100%. For examples on 11th it was 318 million dollars and up to 9th Jun this token was at its most recent peak of the market cap and that was more than 695 million dollars.
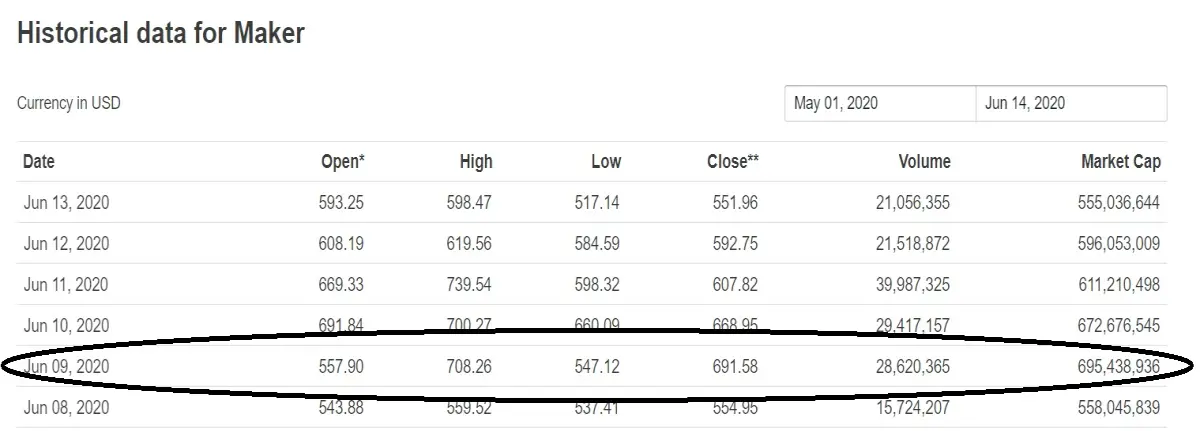
https://coinmarketcap.com/currencies/maker/historical-data/?start=20200501&end=20200614
And if we visit the coinbase blog then on 29th of May they added announcement on their blog that Maker is launching on coinbase pro. Even though the MKR token was already moving up but after this announcement its price increased by 110% more.
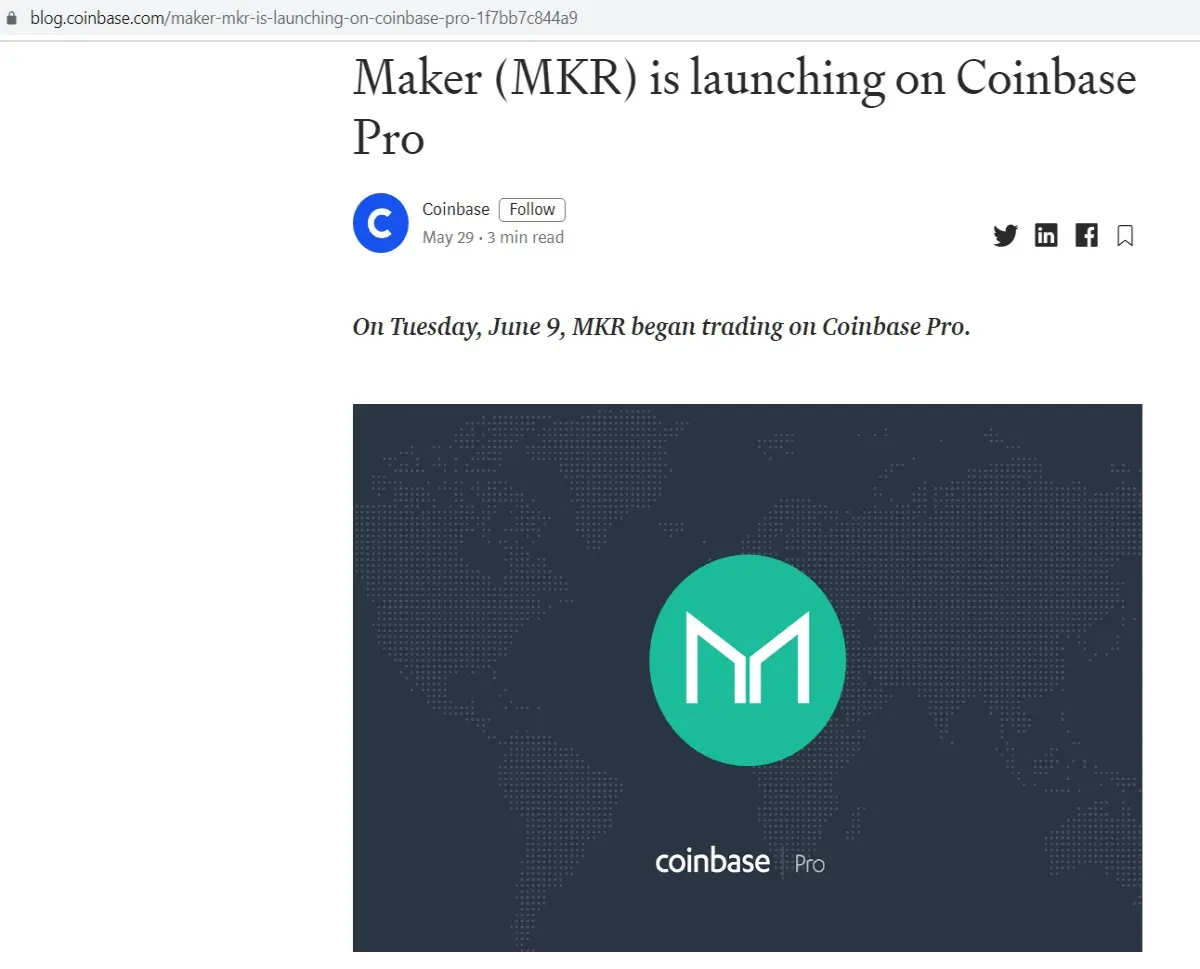
https://blog.coinbase.com/maker-mkr-is-launching-on-coinbase-pro-1f7bb7c844a9
Now if we see the movement of the Maker token from the lowest price of March 2020 up to the highest price of this June then it's surged more than 350%. At this time on weekly chart it is moving within a down channel. And this moment of the price action within this channel is very much synchronized with the combination of three indicators. For example whenever the price action reaches at the support and receives the bullish signals from momentum indicator and the MACD also turns bullish and stochastic gives bull cross then the priceline reached up to the resistance of channel.
Volatility and harmonic moves:
On the same long-term weekly chart the Maker token is forming different harmonic patterns with continuity and consistency. On the below chart we can notice that 1st the Maker formed a complete BAT pattern and after entering the potential reversal zone form 0.786 to 0.886 Fibonacci level it moved up this this move was up to206%. And after that the maker formed a very big bullish Butterfly and after taking bullish divergence from this butterfy’s PRZ level it produced more than 1500% big gains. And finally it has formed another BAT pattern and we can see and from the recent BAT’s potential reversal zone it has taken another powerful bullish move and produced more than 350% this time.
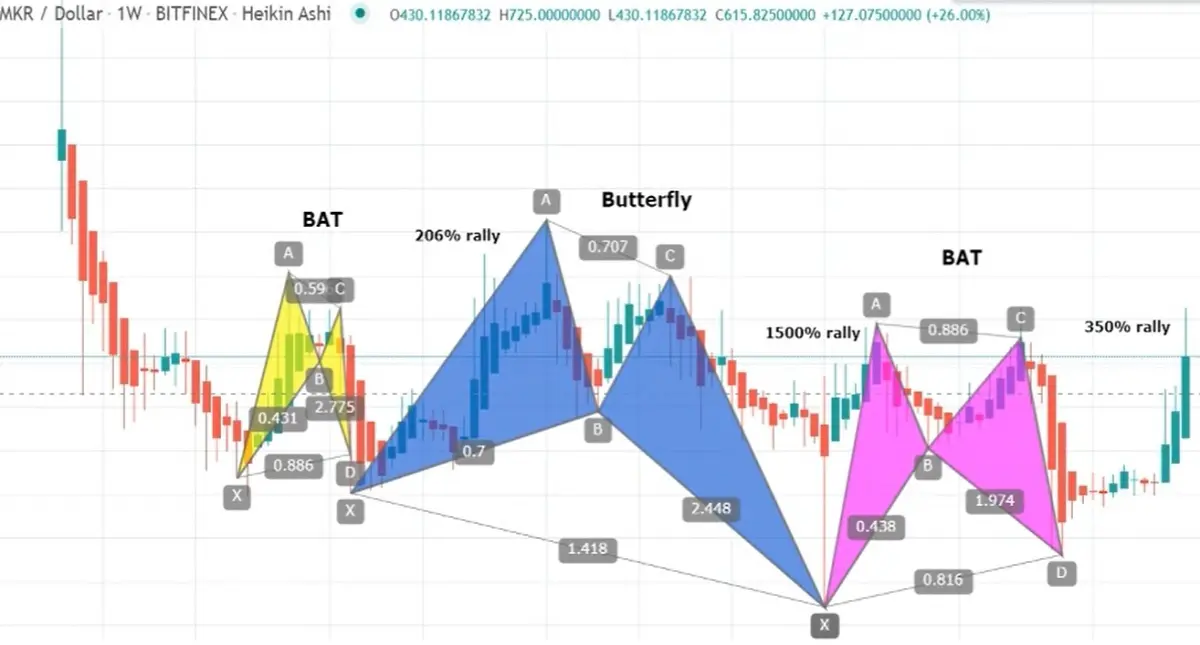
You can also watch below video for better understanding
Formation of up channel and simple moving averages:
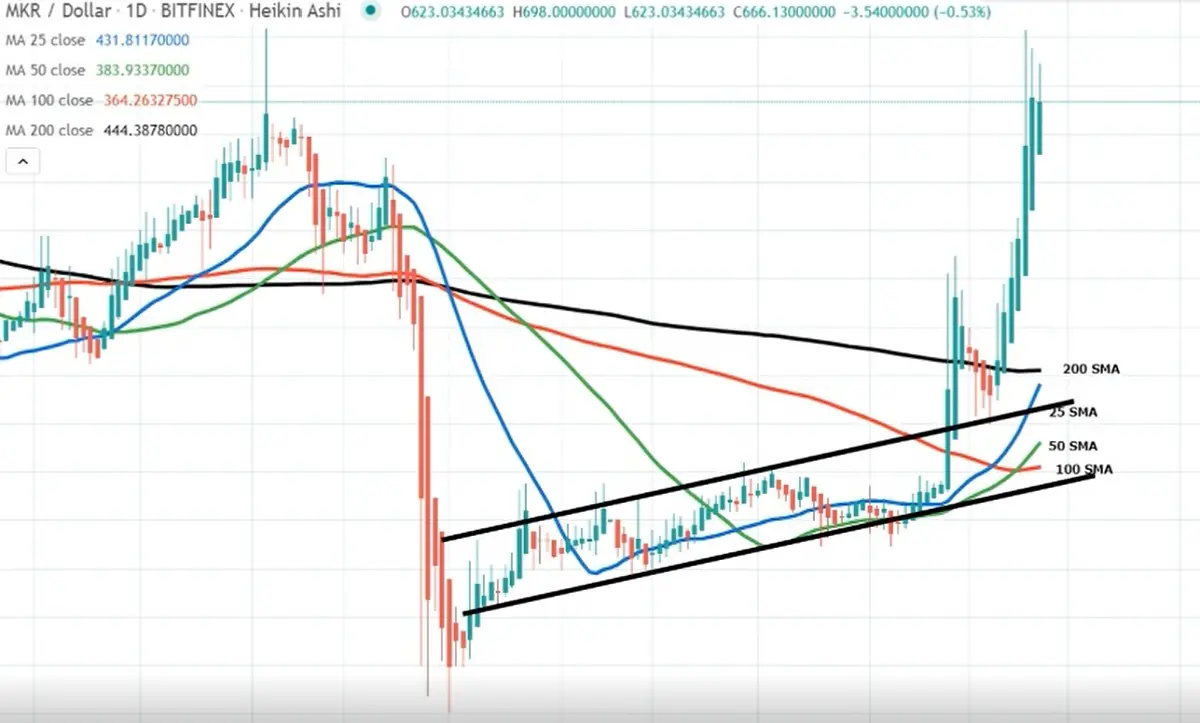
Now what next whether MKR token will move more up or it will be moved down. To understand this we need to switch to the small time period chart to see the current position of the Maker token. And we can see that since after mid of March 2020 price action of MKR was moving within an up channel like Bitcoin and all other top altcoins. But the difference between the Maker and Bitcoin and other top coins is that MKR has broken out resistance of the channel but on the other side the Bitcoin and other top coins are still moving within the channel. The basic reason for this breakout is the announcement on 29th May that was added on the coinbase blog. And from 29th May up till now it has surged more than 110%. Now if we watch the position of different simple moving averages this daily chart then it is very strong as the price action has broken out all the moving averages with the time period of 25, 50, 100 and 200. At this time price action has support of all these simple moving averages on this daily chart. But there is a very big distance between the moving averages and the price action. Therefore at the moment Maker doesn't have any immediate support of the moving averages. And if the price action starts the correction rally from here then it may face a disasters drop up to the support of the moving averages. And we have the first support of 200 simple moving average at $443. However if the moving averages will start moving up to the priceline then the price action may have an immediate support of the moving averages. Then there will be fewer chances of drop.
Long term Support and resistance levels:
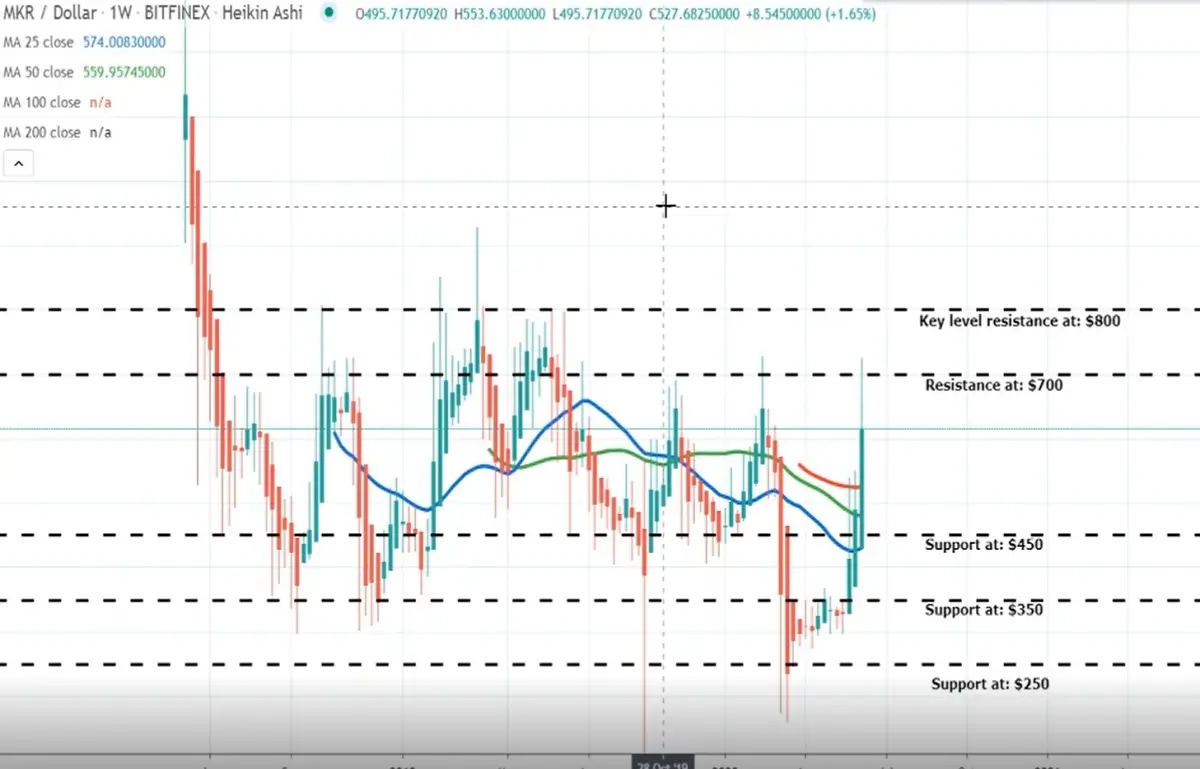
Now if we take a look at different support and resistance levels the long term weekly chart then the price action is being traded between $350 up to $800.
This is the area where originally the price action is being traded. Even though we have some spikes up to $250 therefore our last support for MKR token is at $250 dollars but there are very less chances that the price action will reach up to this level because we have very few spikes up to $250. At this time the $450 resistance level is broken and the priceline has spiked up to $700. The $700 is the very powerful resistance since July 2018 as since then the price action never able to break out this resistance even though we have seen several attempts. Then finally we have the $800 resistance level. And this is the key level resistance. Once it will be broken out then the Maker can make a very big move to achieve the highest price ever in the history of MKR token.
Ichimoku cloud:
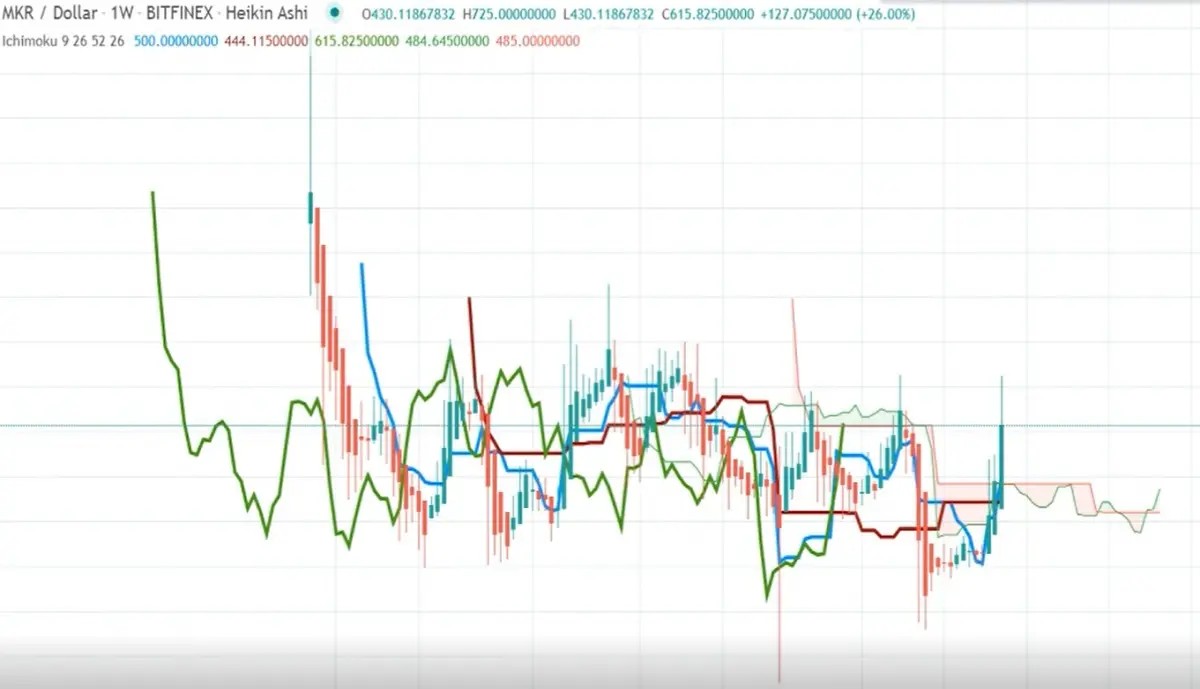
For next big move I am also looking at the ichimoku cloud on weekly chart. Because the priceline of MKR token never able to break out this cloud since this cloud is appeared. But finally at this time are we having some indication by current strong bullish candlestick of MKR token that maybe this time it will break out this is ichimoku cloud. This time we also have some other bullish signals by ichimoku. The first bullish signal is that the lagging span has crossed up the price action and it is also likely to cross up the ichimoku cloud soon. And if we watch the conversion line and the baseline then the conversion line has crossed up the baseline and this another very strong bullish signal and the cloud is also turned bullish. Once the priceline will be able to cross up this ichimoku cloud then it will become is very strong support for the price action as it has been working as a very strong resistance since it is appeared. But if the price action will be not able to breakout this cloud and the $700 resistance level as well then the MKR token may re-test previous support at $450.
Conclusion:
The price action of MKR is struggling to break out the next resistance level therefore we can expect the next long term bullish move once $700 resistance level will be broken out otherwise we can expect a bearish rally up to previous support at $450.






