
Introduction
Hey friends, I hope you're well. Welcome to the latest update on the Jasmy token. Previously I discussed how Jasmy had recently formed another down channel on a 4-hour timeframe chart. Today, we'll analyze the recent movements and patterns of Jasmy. If you haven't subscribed to my channel yet, please do so for more trading signals and updates. You can also support me as a YouTube member or a Patreon member for exclusive trading signals.
Recent Chart Analysis
Breaking Down Long-Term Support
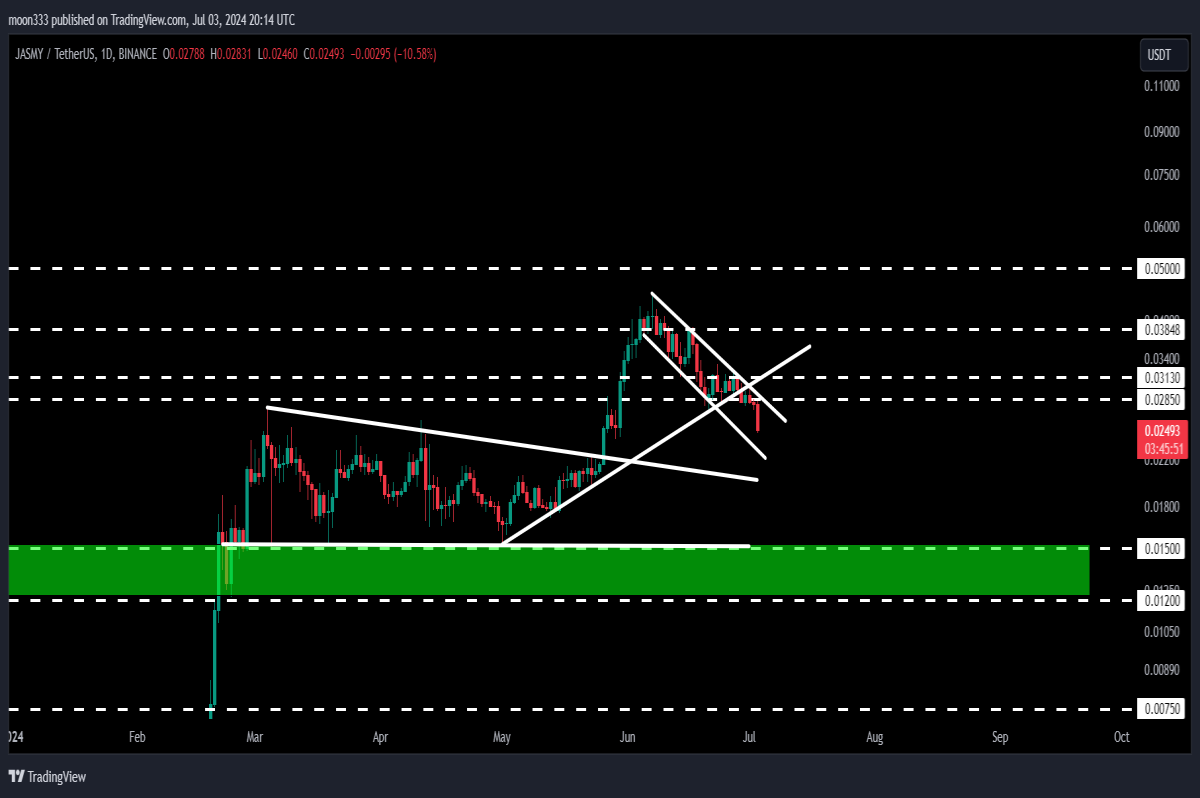
Previously, on the daily timeframe chart, Jamy was moving inside a descending triangle and had an uptrend line support, which it recently broke down. This uptrend line had several rejection points, making it a significant support level. Now, Jasmy needs to break out of the downtrend line resistance and the longer down channel.
Long-Term Falling Wedge Pattern
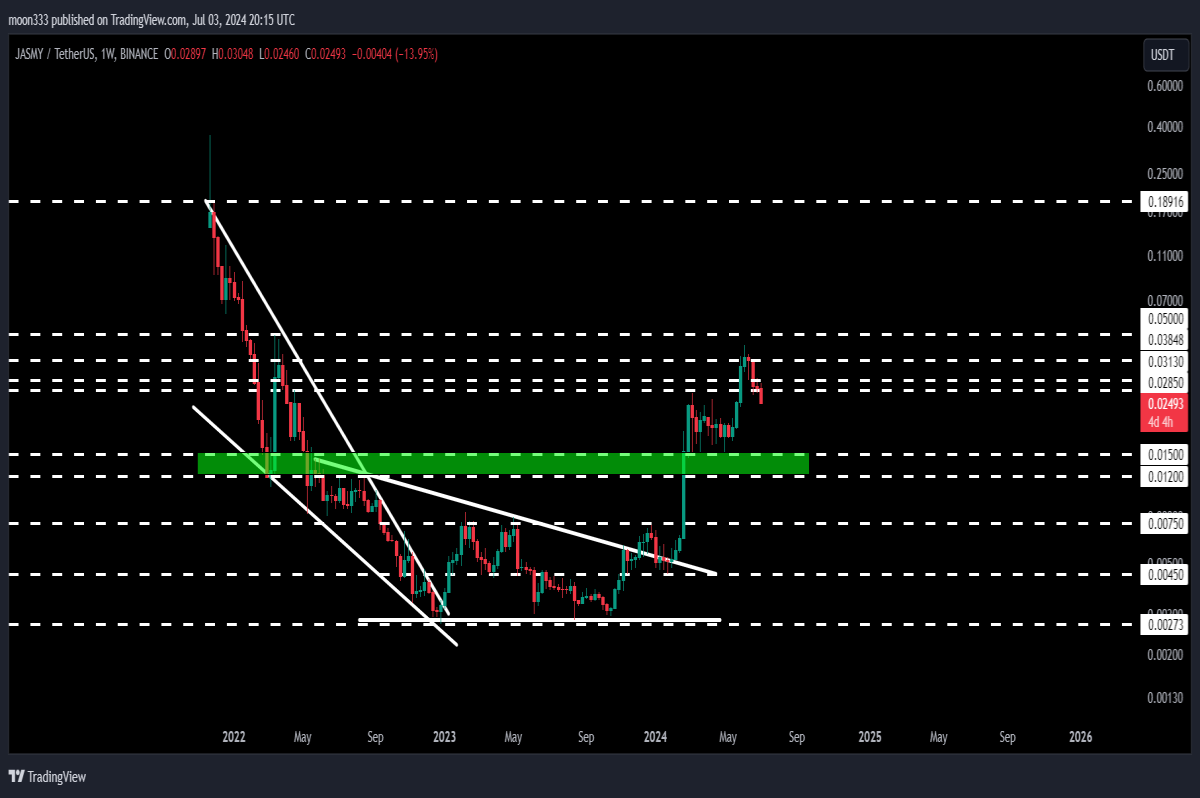
I have previously highlighted a massive breakout from a long-term falling wedge pattern on the 7-day timeframe chart. From the low point to the current level, Jasmi has rallied more than 1539%. This rally and the patterns leading up to it are crucial for understanding future movements.
Recent 4-Hour Time Frame Analysis
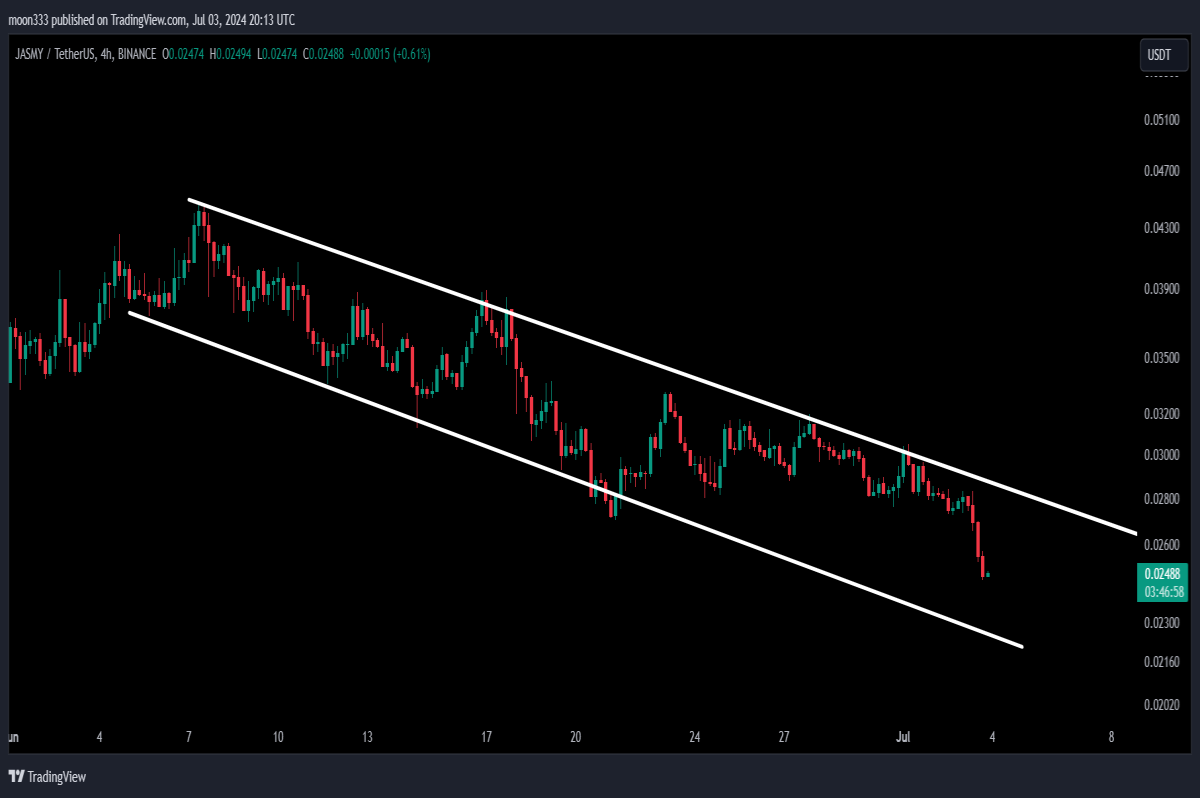
In the 4-hour timeframe, Jasmy is still moving inside a long down channel. While moving down, it broke a significant uptrend line support from the daily timeframe. If rejected by the channel's resistance, the price could test the channel's support around 2.56 to 2.35 cents. However, if it breaks out, the target for the breakout is approximately 4.5 cents.
Weekly Time Frame Resistance
On the weekly timeframe, the 5 cents level has been a strong resistance and could act as a significant barrier again. Breaking this level would be a critical achievement for Jasmi.
Major Breakouts and Targets
Falling Wedge and Descending Triangle Breakout
On the 7-day timeframe, Jasmy has already broken out of a large falling wedge pattern and a descending triangle. The target for the breakout from the descending triangle was approximately 2.5 cents, which Jasmy has surpassed. The long-term target for the breakout from the falling wedge is between 18 to 20 cents.
Conclusion
This was the latest update on Jasmy. I hope you found the analysis helpful. If you did, please hit the like button and follow the blog. For more trading signals, consider supporting me as a YouTube or Patreon member, links are below. Thank you, and take care!


