
In Oct 2019 I posted an article where I revealed that the price action of Zcash has formed a bullish Crab pattern.
The volume profile of the complete pattern was showing that the traders interest is very low in potential reversal zone and moving average convergence divergence (MACD indicator) was also giving strong buying signals and RSI was in oversold zone.
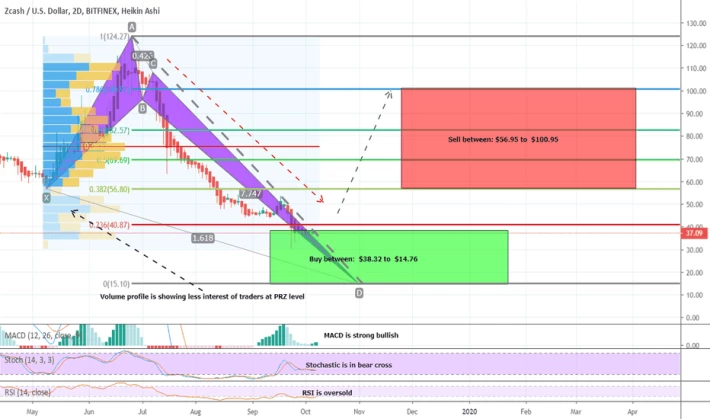
Then from Jan to Feb 2020 the priceline moved up and hit the defined sell zone as per chart and sofart it has gained more than 121% value.
Now the priceline has entered in Fibonacci projection of A to D leg of this Crab pattern and now it is using 0.382 Fibnacci level as support there are some more strong supports beneath the price action which I will discuss latter in this article.
The Oscillators, Indicators And Exponential Moving Averages:
On 12 hour chart the Exponential moving average 10 has formed a bear cross with EMA 20 and it is seems to be a temporary death cross coz MACD has started turning bullish and RSI has given bull cross after hitting the oversold zone and RSI has also visited the oversold.
On Long Term Perspective:
And if we see on long term 2 week chart then the price action has crossed up the EMA 10 and almost crossed up the EMA 20 as well this candle stick on this 2 week chart will be decision maker or may the next one whether the they will be closed above the EMA 20 or not.
Once the pirceline will be completely closed above the EMA 20 then soon we will also witness the bull cross between EMA 10 and 20 that can produce a very powerful bullish rally.
Ichimoku Cloud And Directional Movement:
The Ichimoku cloud upto 4 days chart is turned bullish and lagging span has crossed up the price action on other side the priceline has crossed up the conversion and base line and conversion line has formed bull cross with base line beneath the candle sticks soon the priceline can cross up the cloud as well and this will be a very strong bullish signal.
Directional movement has also confirmed bullish trend by giving bull cross between +DI and –DI and the ADX is up in favor of bulls having value 45.
Simple Moving Averages | An Alligator’s Mouth Formation:
On daily chart the simple moving averages with time period of 25, 50, 100 and 200 are turning strong bullish by forming an alligator’s opened mouth the 25 SMA has crossed up all other SMAs an 50 SMA has also crossed up 100 and 200 SMAs now the 100 simple moving averages has come very close to 200 SMA to form a golden cross with it then we will have a complete alligator’s opened mouth formation by these moving averages like they formed in Jun 2019 and the price action gave more than 121% profit.
This time again the price action is expected to start a powerful bullish rally after an alligator’s mouth formation.
Long Term Supports And Resistances:
On week chart the Zcash has 2 supports one is at $49.81 and last support is at: $ 26.64 at this time the price action of ZEC is above $49.81 support and fighting the next resistance level at $76.90.
The priceline went very close to the resistance at $76 and dropped down but here we have a very strong support of 50 simple moving average which is holding the price action and not letting the price action move more down.If I would be holding the ZEC for long term then I would make this 50 SMA on week chart as my stop loss because this is very strong support or the previous support at $49.81 can also be used for this purpose.
Chart Patterns:
This time ZEC has formed a Cup & Handle pattern on very short term 2 hour chart the resistance of the Cup is at $ 65.58. The wave up and wave down has formed the body of the cup very softly and there is no V shape or hard corners and then the price line had a pull back to form the handle of the cup and after forming the handle the price action moved up and broke out the handle’s resistance and soon it will also breakout the Cup’s resistance at $65.58.
After breaking out the Cup’s resistance we can see the priceline may try another attempt to breakout the long term price level resistance at $ 76.90.






