
Introduction
In this update on Bitcoin, we will analyze its current position within a significant uptrend channel and explore the indicators suggesting potential price movements.
Overview of Bitcoin's Weekly Time Frame
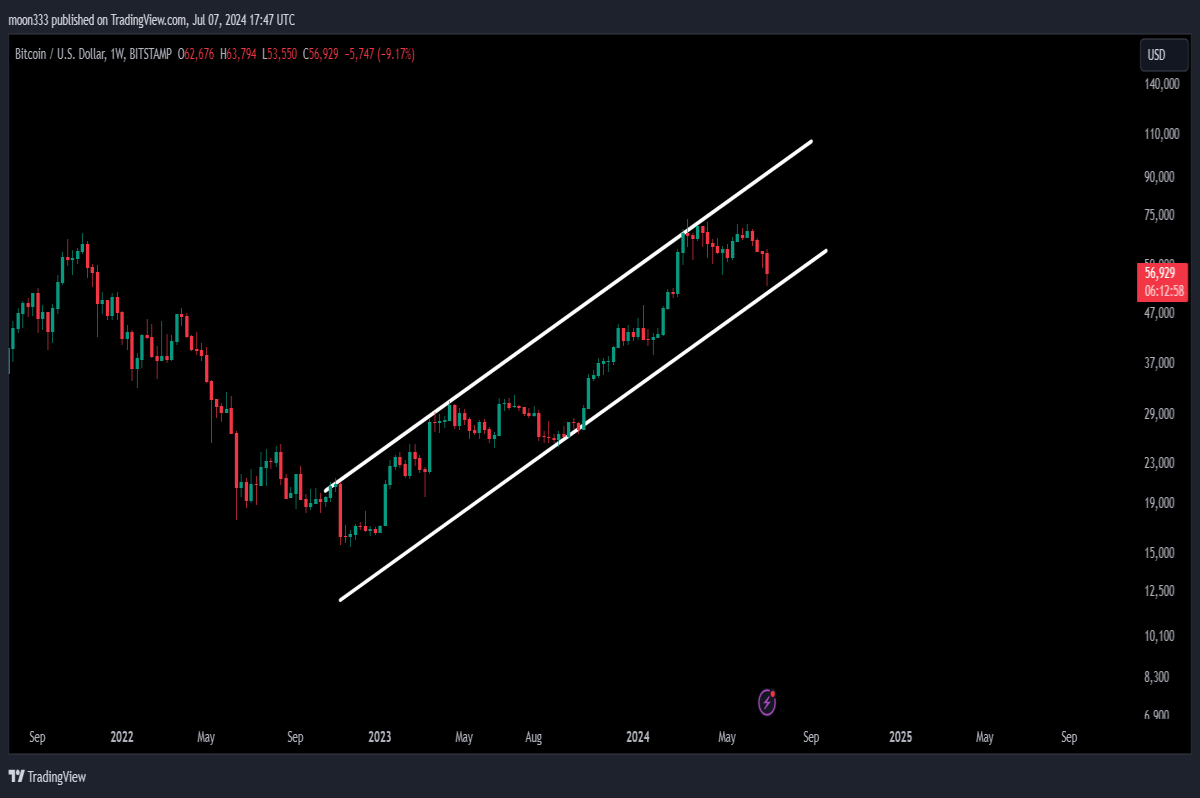
On a weekly time frame, Bitcoin is currently navigating a long-term uptrend channel, characterized by repeated rejections at resistance and multiple touchpoints at support levels.
Current Price Action and Support Levels
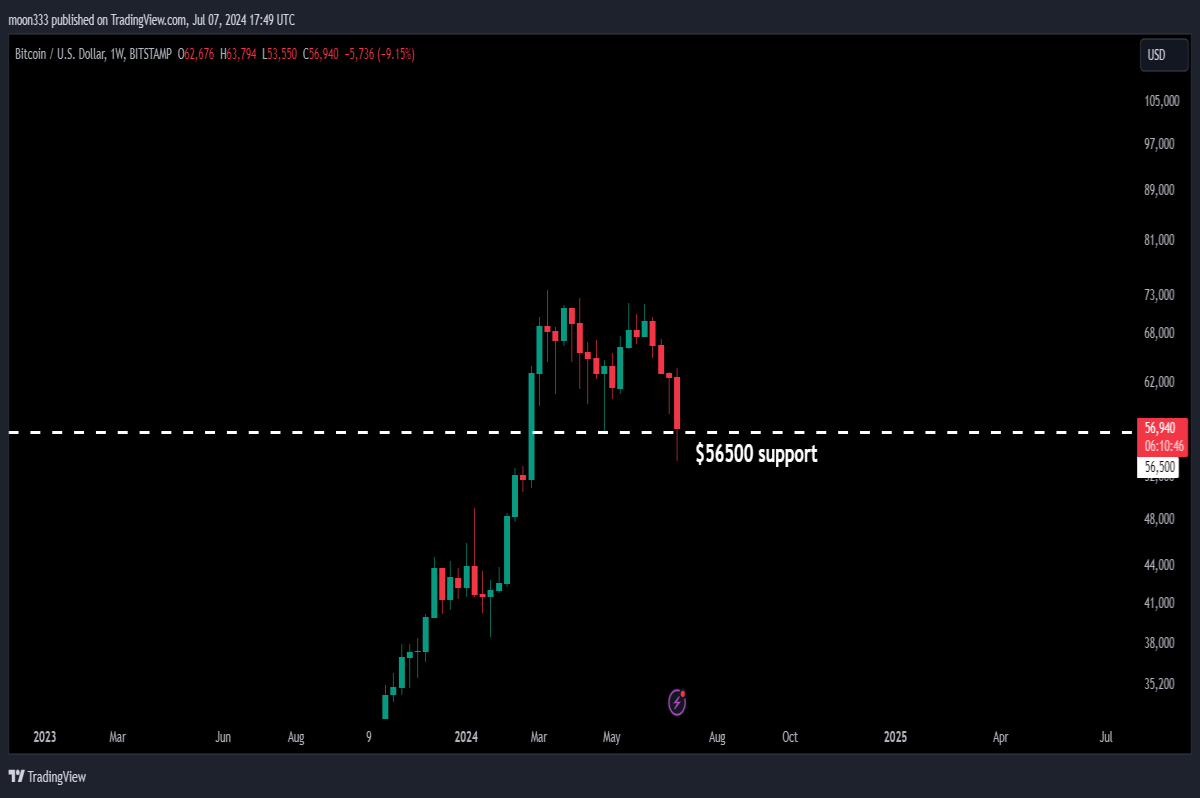
Bitcoin is approaching crucial support levels, notably targeting the lowest price since May 2024 at $56,500. Insights into short-term and long-term support zones are crucial for understanding potential price movements.
For detailed analysis, you can also watch the below video from my channel:
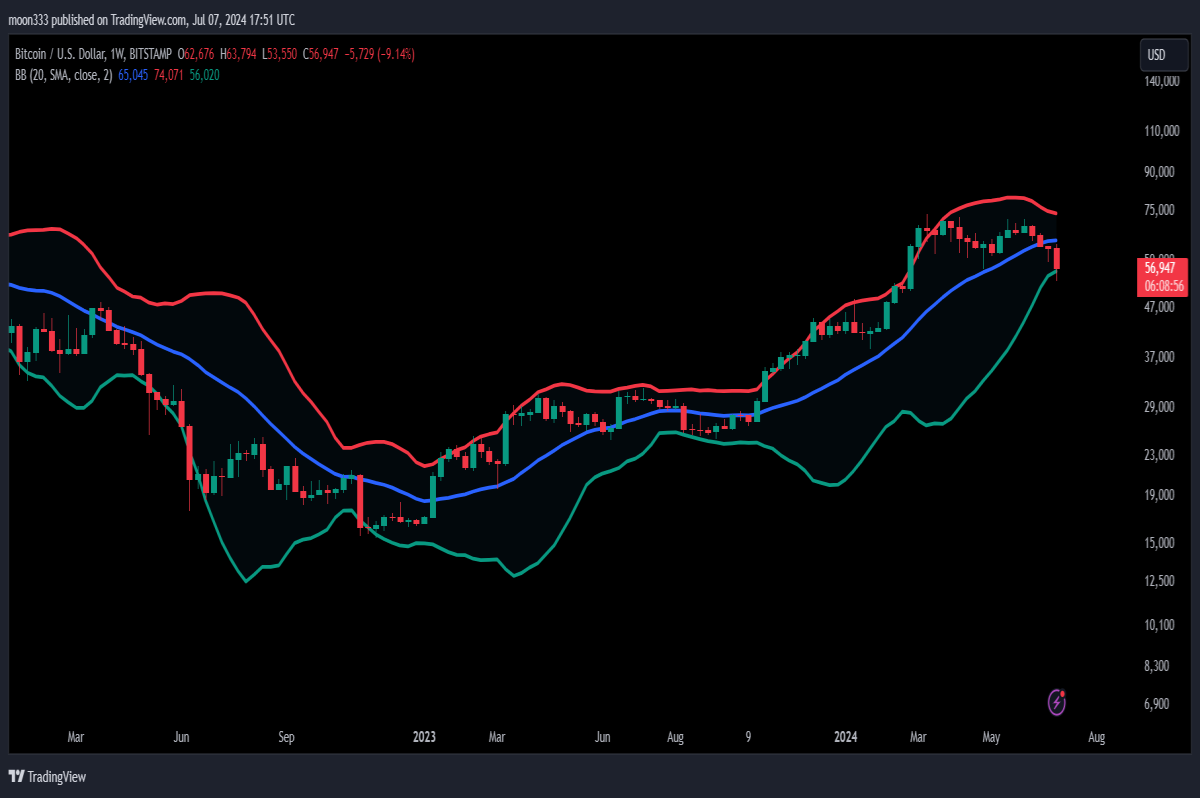
Analysis of Bollinger Bands
A detailed examination of the Bollinger Bands reveals that Bitcoin has recently breached the basis (middle line), signaling a possible downtrend continuation. The proximity to key technical levels like the green line suggests potential bounce or breakout scenarios.
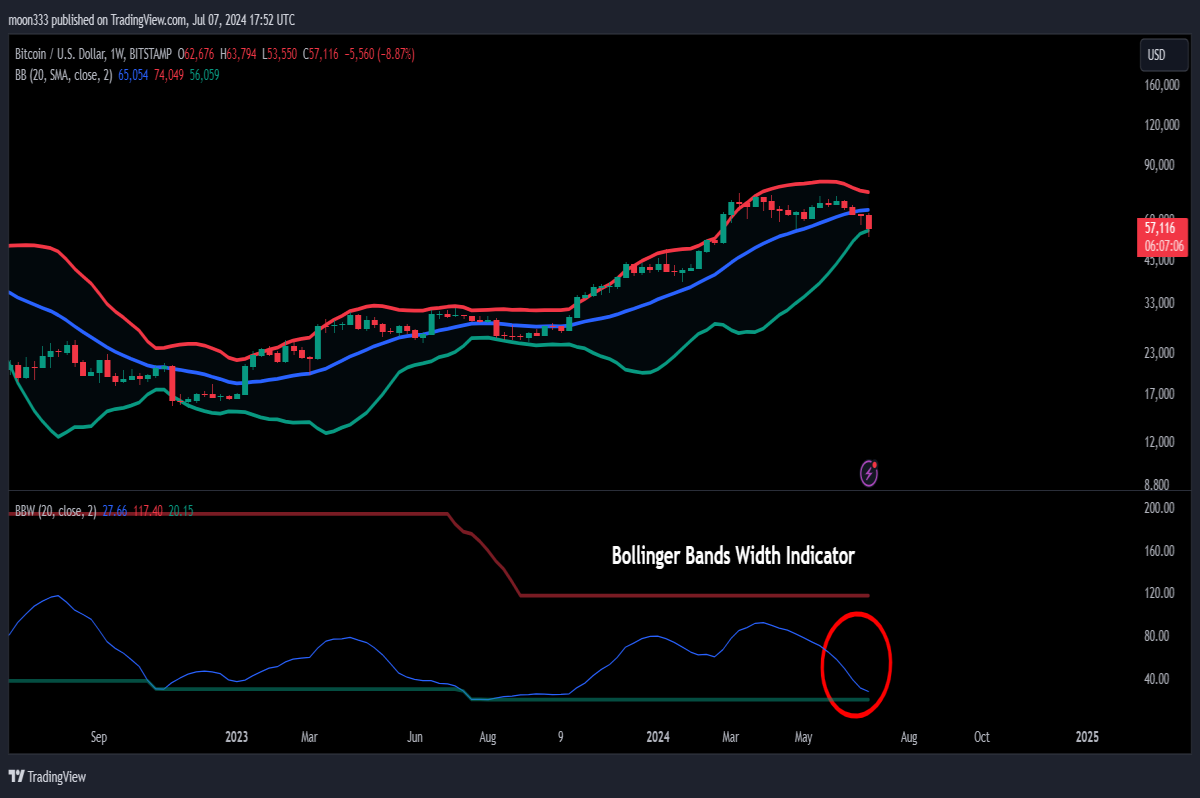
Bollinger Bands Width Indicator
The Bollinger Bands Width Indicator indicates a narrowing band, typically preceding significant price movements. Historical precedents and current trends suggest volatility ahead, with implications for both bullish and bearish scenarios.
Double Top Formation on Weekly Chart
Bitcoin has formed a notable double top pattern on the weekly chart, signaling a critical resistance level around $73,000. Analysis of past price behavior post-double top formations provides insights into potential price direction.
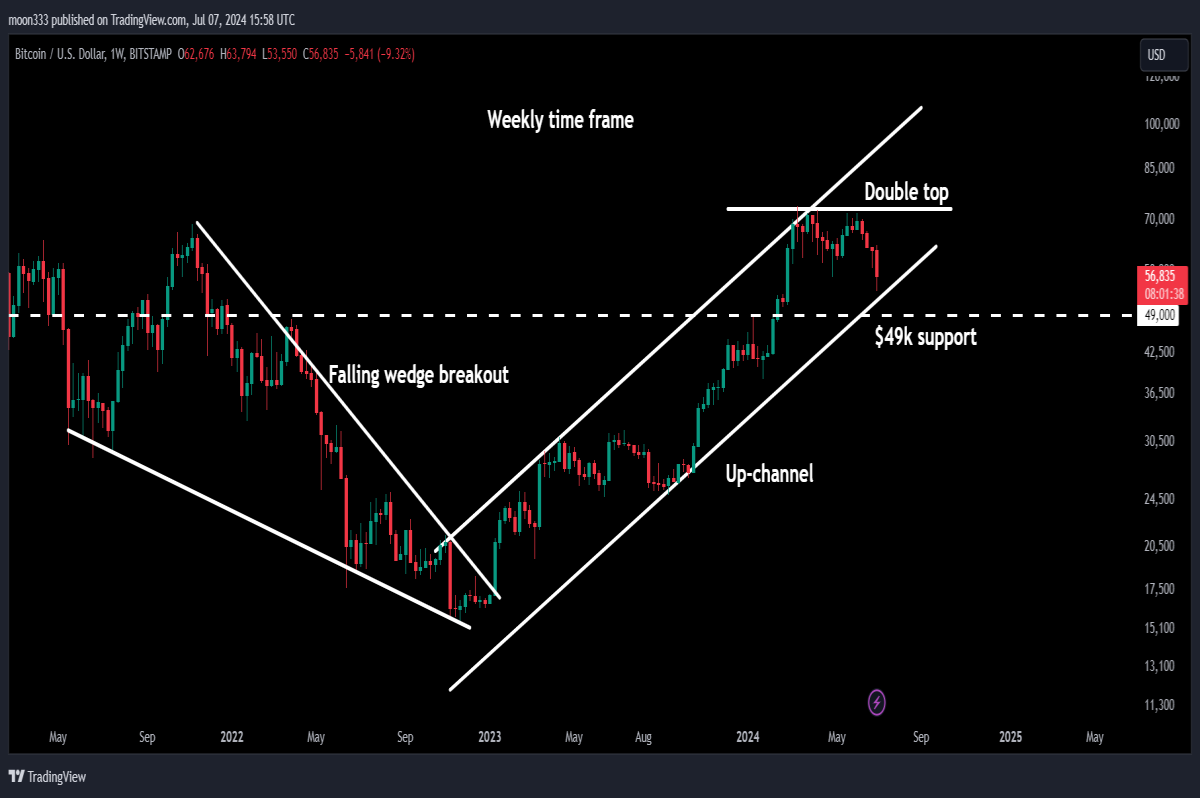
Potential Scenarios and Resistance Levels
Discussion on potential breakout scenarios, particularly focusing on clearing resistance levels marked by the Bollinger Bands and the double top formation. Targets for bullish continuation towards channel resistance at $100,000.
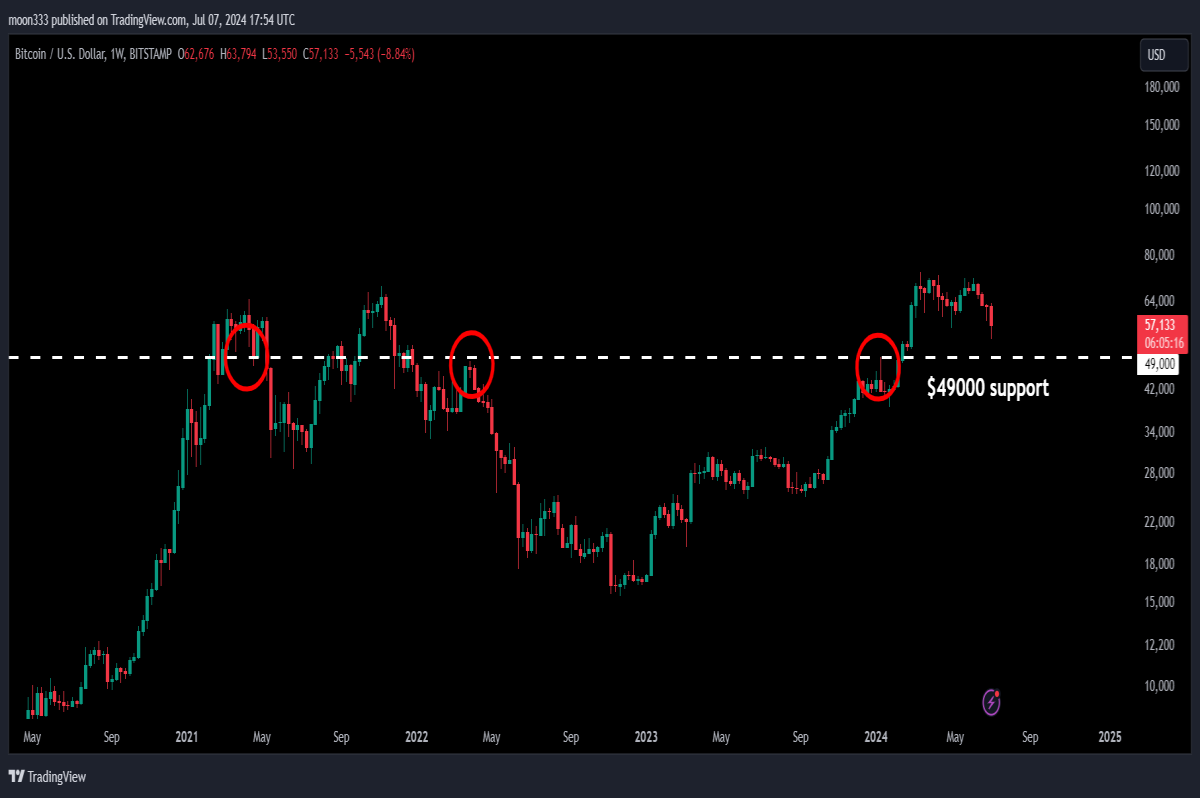
Key Support at $49,000
Highlighting the significance of the $49,000 support level, historically pivotal as resistance-turned-support, emphasizing its role in defining Bitcoin's near-term price trajectory.
Conclusion and Trading Strategy
In conclusion, Bitcoin's current position within its uptrend channel and the dynamics observed through Bollinger Bands indicate a crucial phase. Traders should monitor key support and resistance levels closely:
- Key Resistance: $73,000 approx.
- Key Supports: $56,500, and $49,000
Understanding these levels will be crucial in determining Bitcoin's next directional move. For more detailed trading signals and updates, followers are encouraged to join my YouTube or Patreon memberships, links are as below:


