
Hello friends hope you are doing well and welcome to the new update on Bitcoin. Today we will have the Bitcoin analysis on short term, the midterm and on the long term as well. And we will watch different chart patterns that BTC has formed and the support and resistance levels and also the different moving averages.
Donald Trump Said The Treasury Secretary to ‘Go After Bitcoin’:
First of all I would like to share this news with you and this is this story of almost every cryptocurrency news site that Donald Trump told the treasury secretary to go after Bitcoin.
As per the John Bolton’s new book ‘The Room Where It Happened’, Trump was against BTC long time before his tweet against Bitcoin in July 2019.
In an article of June 18 in Forbes about Bolton’s new book, The Room Where It Happened, it is revealed that Bolton heard Trump told Treasury Secretary Steven Mnuchin to “go after Bitcoin.”
Friends, what you think about this news whether it will affect the price action of BTC and the Bitcoin will be dropped due to this news or not? you can share your opinion in the comment section, Iwill be waiting for your opinions. In my point of view this news is very significant for the priceline of Bitcoin. Because this news is just came out of the blue when the price action was just trying to break out a very strong resistance and the rejection line that is formed since 2017. And this is the resistance of a very big multi years based symmetrical triangle. That was started in 2017 and so far the perception is not able to break out the resistance of this triangle. I will come back to this triangle before this I would like to share some short and midterm analysis.
The formation of harmonic BAT:
In my previous posts I told you that the price action is completing the final leg of bullish Gartley and 1st I predictred that the price action will be dropped from $9300 to $9000. Then in next article I shared that price action may behave like BAT pattern rather to behave like Gartley. And as per Fibonacci sequence of bullish BAT I predicted that it can drop from $9,000 to $8800. And finally the pricline of BTC dropped up to $8900 and completed the final leg of bullish BAT. Now at this time this potential reversal zone has become very strong support for the price action of leading cryptocurrency.
Before execution: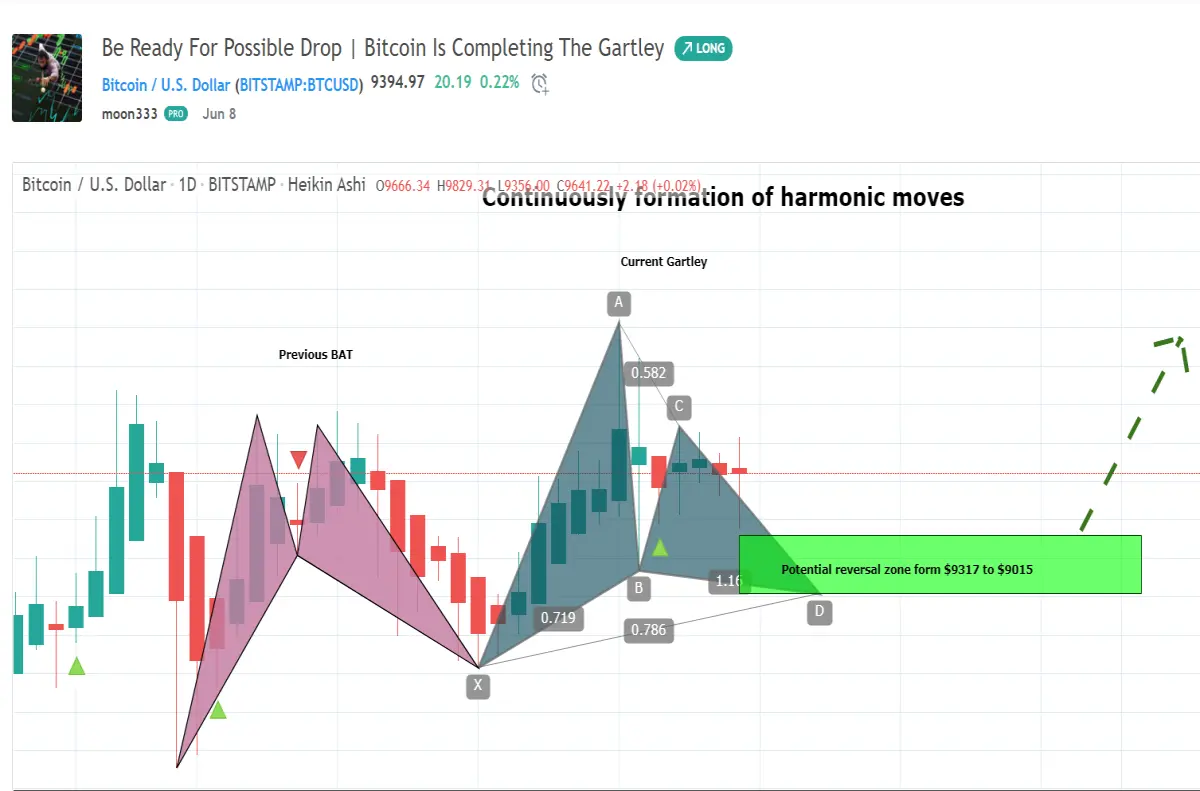
After execution:
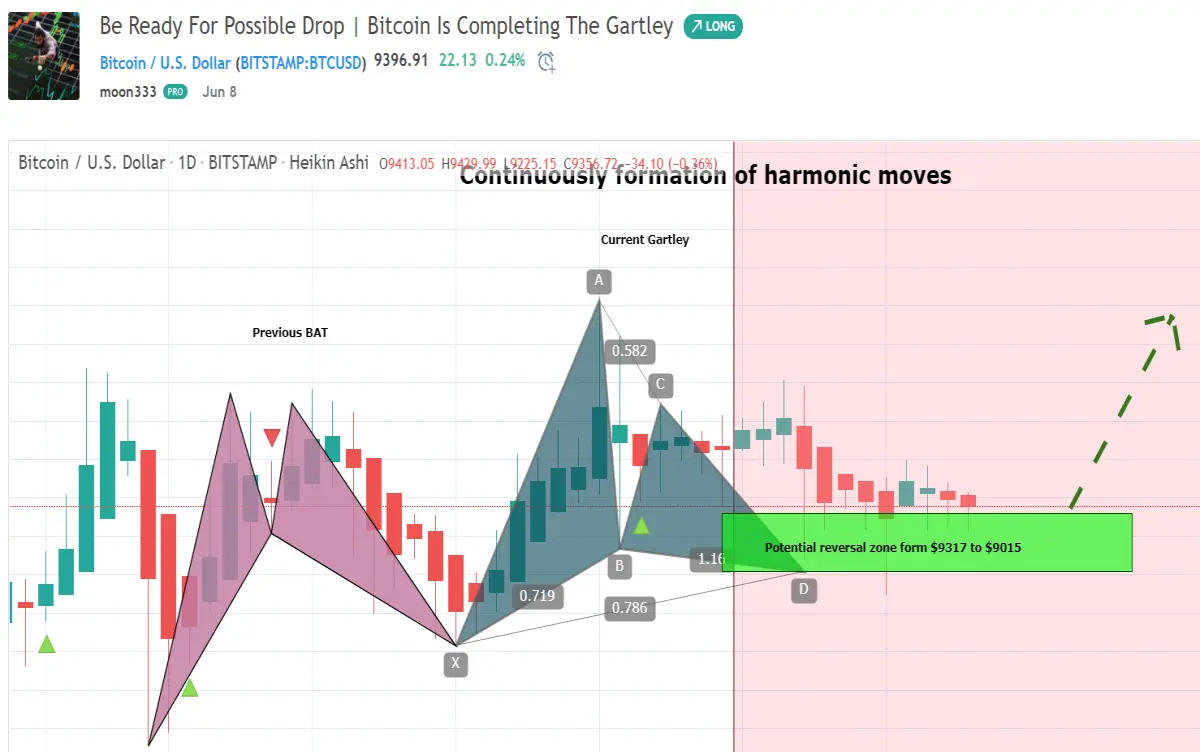
Click here to visit this old article on tradingview
You can also watch this video for better understanding
Support and resistance level:
Now I would like to show you different support and resistance levels on daily chart. At this time the price action has $8800 as support. This is the same level where we have the potential reversal zone of bullish BAT pattern.The next resistance level at $9500 and after $9500 the next resistance level is $10,000. Few days back $9500 was working as support but at this time after breaking down this support the Bitcoin is retesting this level as resistance. And if the price action will be not able to break out this resistance again then it will be again dropped previous support level that is at $8800.
Formation of down channel on short term chart:
Now the Bitcoin is moving between $9300 to $9500. And if we switch to the short term 1 hour chart then it can be easily observed that the protection is moving very well within a down channel. The support of this channel is at $9300 and resistance is at $9500. And this is a little bit down channel therefore if the price action will not breakout this resistance soon. Then this resistance will be moved more down.
Up channel on daily chart has been clearly broken down:
Now lets move to the daily chart and here the Bitocoin has formed an up channel after mid of March 2020. And we received a very clear signal by the moon phases indicator that the priceline may break down the support because the new dark moon was appeared at distance from the support. And in order to reach at this level of dark moon the priceline needs to break down the support of this channel. And finally the priceline broke down the support. And now we have 5th candle stick closing below the channel.
Bitcoin and other markets:
If we compare the price action of Bitcoin to other markets for example this if we take an example of S&P 500 that is most outperforming index. We can notice that Bitcoin was more stronger than the other market. Like there the price of Bitcoin broke out all the simple moving averages with the time period of 25, 50, 100 and 200 on 30th April but on the other side the priceline of SPX broke out all these simple moving average on 29th of May 2020 there is a difference of a complete month. And now S&P 500 has bounced from 25 simple moving average. But the Bitcoin has broken down the 25 simple moving average and now it is at the support of 50 simple moving average. Therefore there will be chances that the pricleline will breakout the 25 SMA again. Because pressure from the downside is more than the pressure from the upside because the simple 25 is smaller than 50 simple moving average. And there is some correlation between Bitcoin and other markets. If the BTC will follow stocks and indexes then definitely it will again breakout 25 simple moving average.
The pennant is still there:
The BTC has also formed a pennant on daily chart. In order to see whether this the Bitcoin will be dropped or not. We should observe very closely that the price action will break down the support of this pennant or not. I observed that the priceline of BTC is very much synchronized with the combination of three indicators: stochastic, MACD and momentum. For example whenever the price action reaches at the support then stochastic gives bull cross and MACD also starts turning bullish and momentum changes from bears to bull then Bitcoin reaches at the resistance. At this time the price action is at the support and stochastic has also given the bull cross and MACD is turning bullish but momentum did not give any bullish signals, therefore we need to wait for the momentum for the final confirmation whether price action will break down the support or not. But it from here to stochastic will again give bear cross and MACD will turn strong bearish then priceline can break down the pennant.
Very big symmetrical triangle:
Now let's talk about big symmetrical triangle that has been formed on the long-term weekly chart by the price action of Bitcoin that we discussed earlier at the starting of this post. And the resistance of this symmetrical triangle has become very strong rejection line for the Bitcoin. Whenever the price action hits at this resistance level then it is being rejected again and again and this time after hitting resistance level the price action is again likely to be rejected. If the Bitcoin will move all the way down up to the support of this triangle then we may see $6,000 level.
Click here to create free account on tradingview to watch and play the chart on realtime
Conclusion:
Everytime after hitting the resistance of the big symmetrical triangle that Bitcoin moves all the way down to the support. At this time the price action is at the end of symmetrical triangle, therefore, the breakout or break down is expected soon. But the further downward move after being rejected by the resistance of this triangle depends on the breakdown of the pendant's support that has been formed on the daily chart.






