
Introduction
Hello everyone, and welcome to the latest update on Fantom Coin. In my previous articles & videos, I highlighted the formation of a new bullish pattern—a down channel on the daily time frame chart. Today, we’ll delve into the current status of this channel, analyze recent movements, and explore a significant breakout that has occurred on the seven-day time frame chart.
Current Analysis of the Daily Time Frame
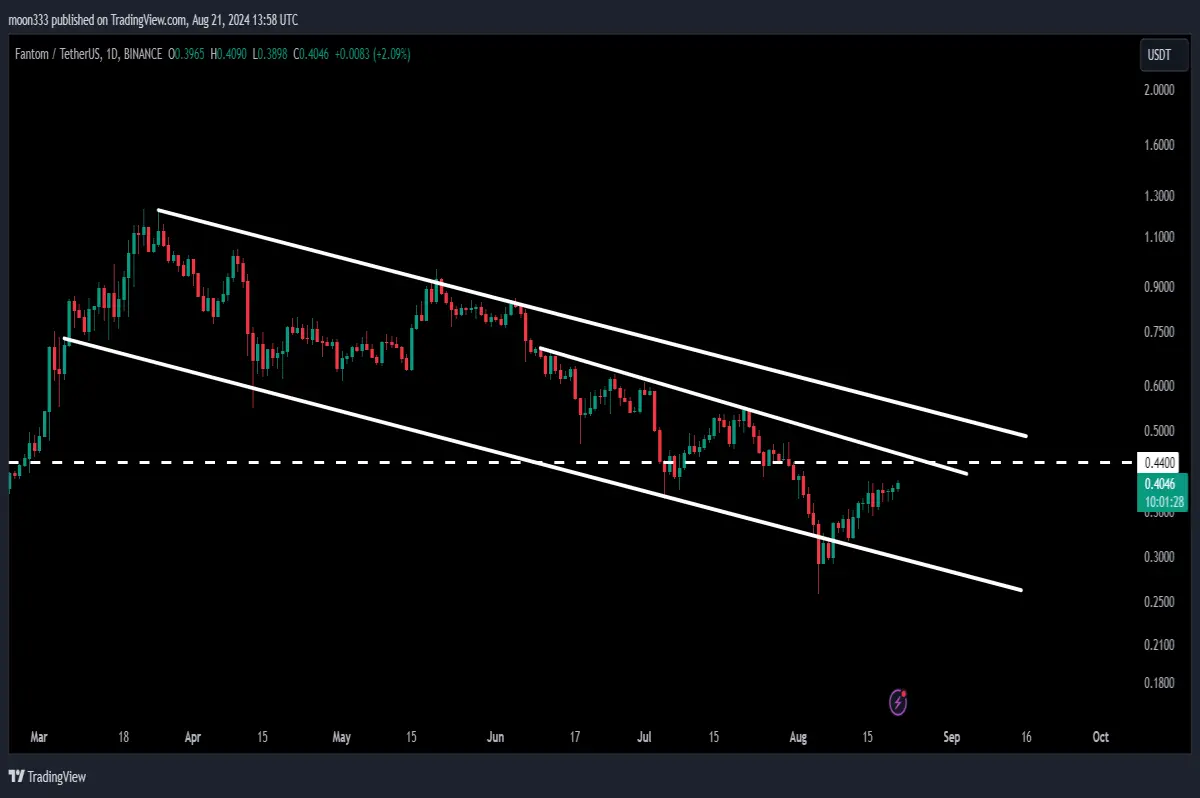
As observed in the daily time frame chart, Fantom Coin is still confined within the down channel. Recently, a new downtrend resistance line has emerged, which needs to be broken for the price to make a significant move. To provide a comprehensive analysis:
- Resistance Levels: The price is approaching a crucial resistance point at 44 cents. Additionally, there is a downtrend line resistance that needs to be overcome.
- Support Levels: The coin has recently bounced from a long-term support at 25 cents, indicating strong support at this level.
Breakout Analysis on the Seven-Day Time Frame
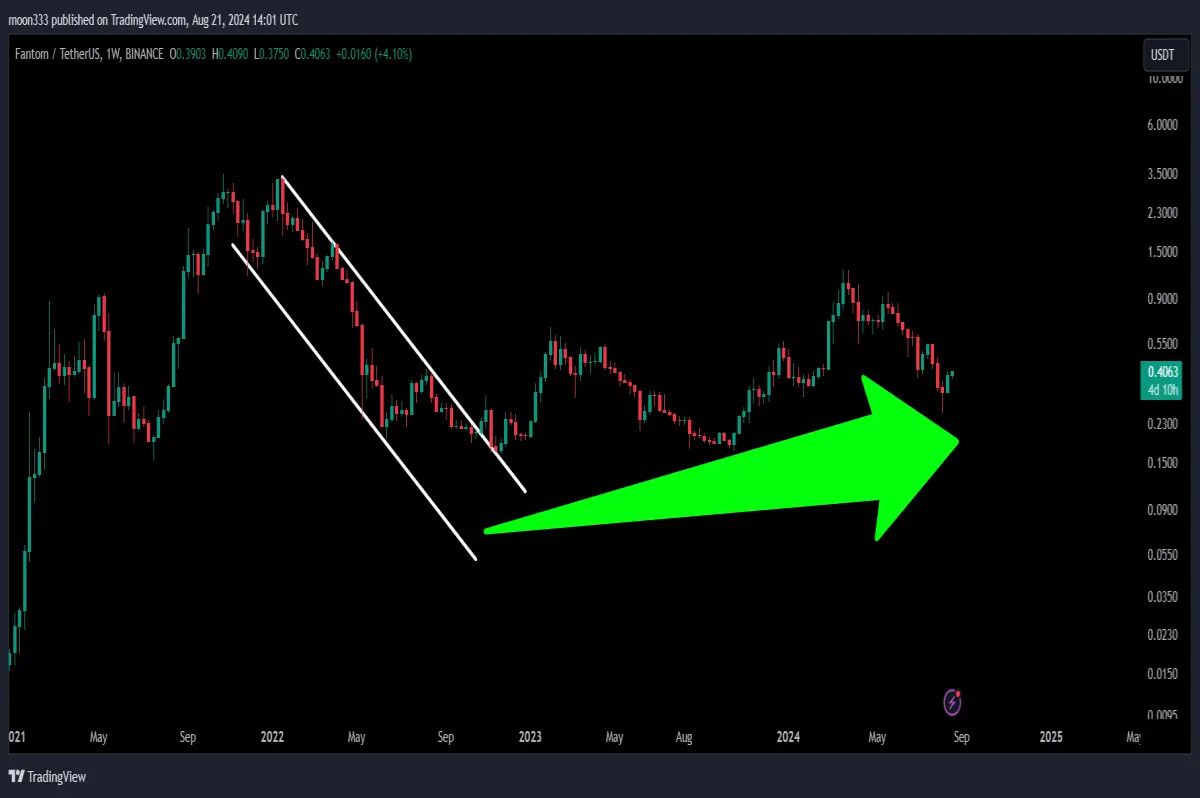
On the seven-day time frame chart, a substantial breakout has already occurred from a significant down channel. Here’s a detailed look:
- Previous Down Channel: The breakout from this channel has been remarkable, with Fantom Coin rallying more than 646% from the breakout point.
- Current Target: The technical target for this breakout is between $3.50 to $4, signaling a potential major upward movement.
For detailed analysis, you can watch the below video:
Resistance and Target Levels
Moving forward, Fantom Coin faces two main resistance levels:
- Short-Term Resistance: The immediate resistance from the downtrend line and 44 cents needs to be surpassed.
- Long-Term Resistance Zone: This zone, ranging from 95 cents to $1.16, has historically served as both support and resistance. It remains a strong barrier to further price increases.
Future Projections
If Fantom Coin successfully breaks through these resistance levels, the technical target for the top of the channel is approximately $1.23. Furthermore, breaking this down channel could position the coin to challenge the long-term resistance zone on the seven-day chart.
Conclusion
In summary, Fantom Coin is navigating within a down channel with significant resistance and support levels. The recent breakout on the seven-day chart demonstrates strong bullish potential. If the coin can surpass the immediate resistance levels, a substantial rally could follow, with potential targets reaching between $3.50 to $4.
For more detailed trading signals and to support this analysis, consider joining as a YouTube or Patreon member. Links to join as below:





