
Introduction
Welcome to this update on Fantom Coin. In recent videos, we have explored how Fantom Coin has been breaking out of various patterns. Most recently, the coin has been trading inside a down channel, and today, we’ll analyze its current position and potential future moves.
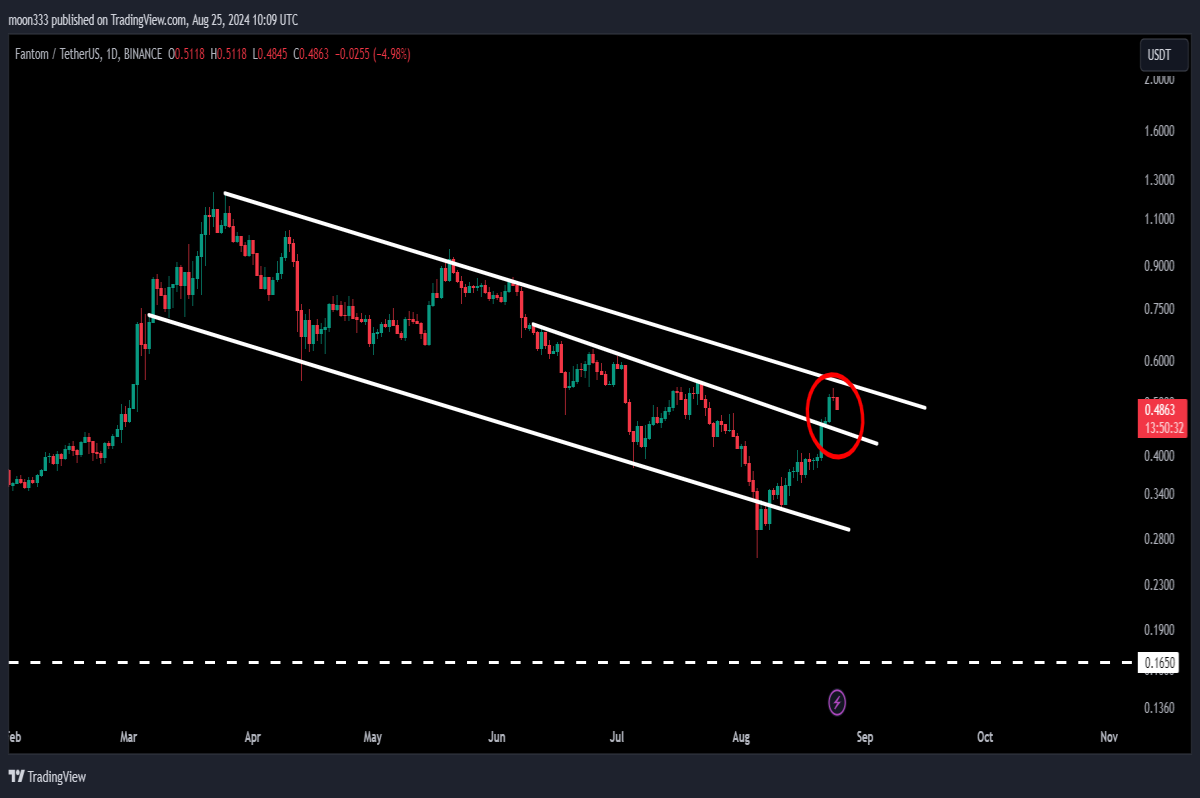
Recent Breakout and Current Position
On the daily time frame chart, Fantom Coin has recently broken out of a downtrend resistance. This breakout is significant as the coin now approaches the resistance of the down channel it's been trading within.
Previously, after a breakout from another channel, Fantom Coin initiated a strong rally. From that point to now, the coin has increased by nearly 650%. However, it has not yet broken through the key resistance level that has proven to be a challenge.
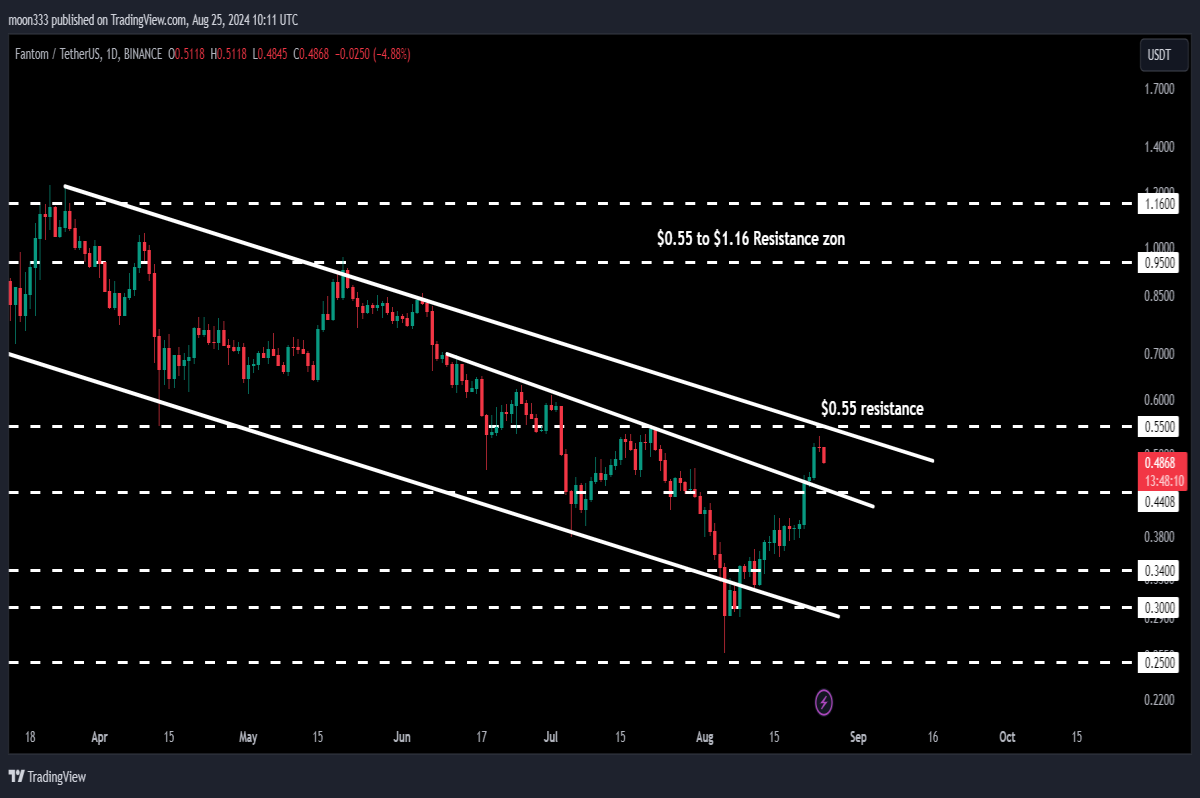
Key Resistance Levels
Fantom Coin is currently approaching a strong long-term resistance at 55 cents, which also coincides with the resistance of the down channel. Breaking this level could lead to significant upside potential.
Should the coin break out of this down channel, the technical target for the breakout would be at the top of the channel, around $1.22. However, before reaching this target, Fantom Coin would need to overcome another substantial resistance zone between 95 cents and $1.16.
For detailed analysis, you can watch the below video:
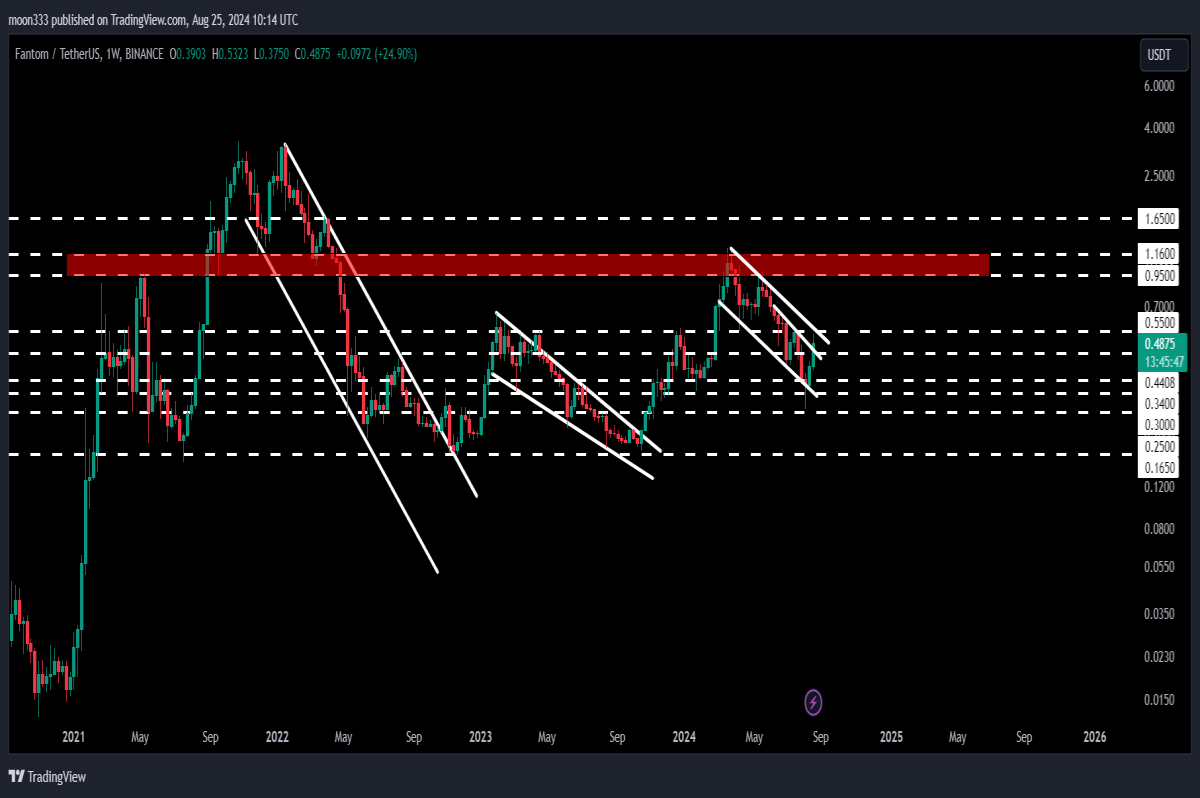
Historical Resistance and Future Potential
On the 7-day time frame chart, Fantom Coin has already broken out of a previous down channel and a falling wedge pattern. Despite this, the coin was rejected by the long-term resistance zone ($0.95 to $1.16) mentioned earlier.
Historically, this zone has acted as both support and resistance, and Fantom Coin will need to break through it to continue the rally that began after the breakout from a long-term down channel in October 2022.
If Fantom Coin successfully breaks this long-term resistance, the next technical target could be between $3.50 and $4.00, representing a significant potential upside.
Conclusion
Fantom Coin is currently at a critical juncture, approaching key resistance levels that will determine its next major move. If it can break out of these levels, there is substantial upside potential.
For more detailed trading signals and updates, consider joining me as a YouTube or Patreon member, where I share regular trading insights and setups. Links to join are as below.


