
Introduction
Hey friends, hope you are well, and welcome to the new update on Bitcoin. On the daily timeframe chart, Bitcoin has completed the Elliott Wave structure. Let's delve into the details and analyze the recent movements and potential future trends.
Elliott Wave Structure
Wave Analysis
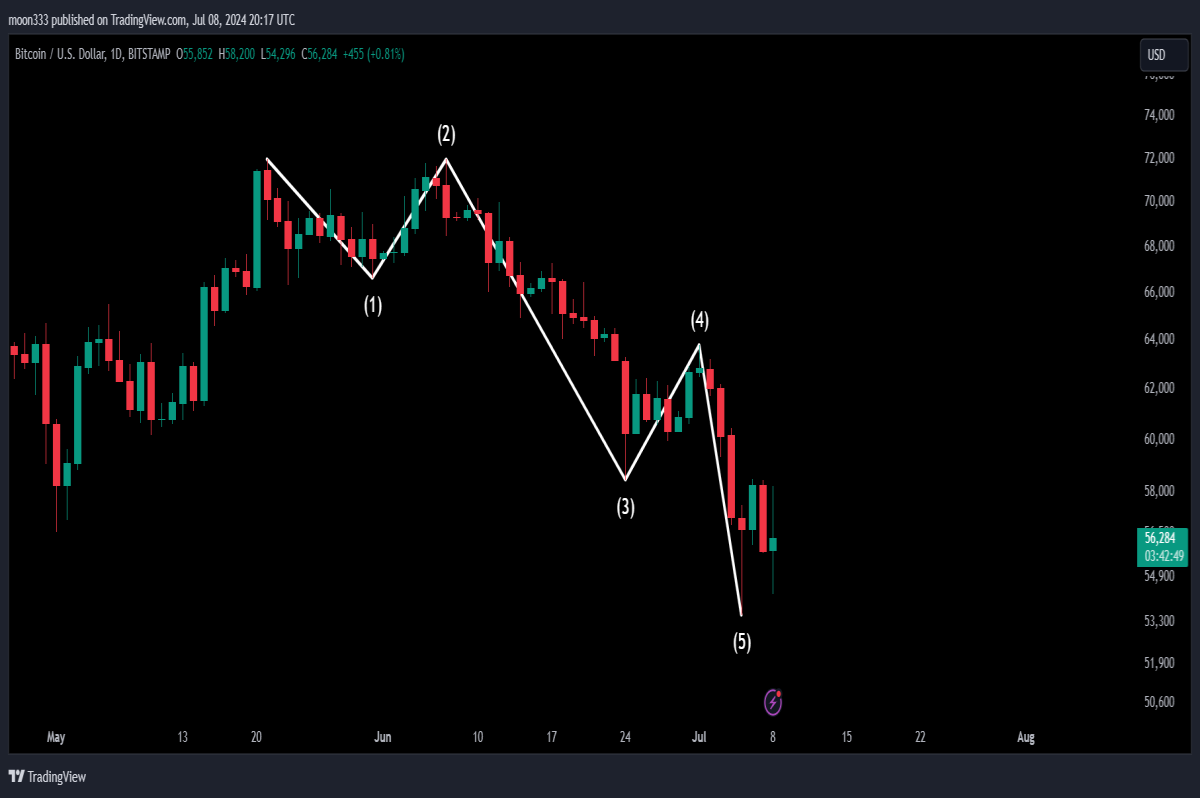
- Wave 1 and Wave 2: The downtrend begins with Wave 1, followed by Wave 2, which does not retrace more than 100% of Wave 1.
- Wave 3: This is the longest impulsive wave.
- Wave 4: A correction wave that does not enter the territory of Wave 1.
- Wave 5: Slightly longer than Wave 1.
For detailed analysis, you can also watch the below video:
ABC Correction
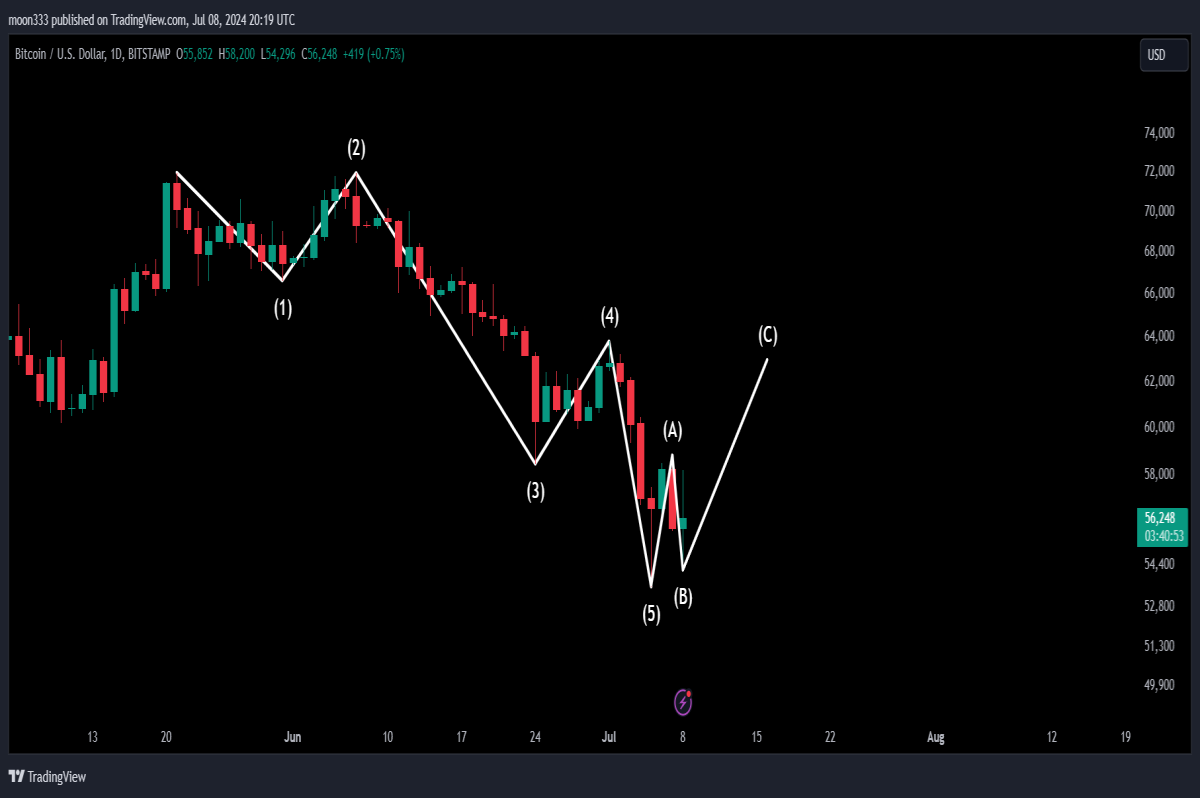
- Wave A and Wave B: The correction waves A and B are identified.
- Wave C: If this is the correction Wave C, we can expect a further move to the upside.
Key Resistance Levels
Short-term Resistance
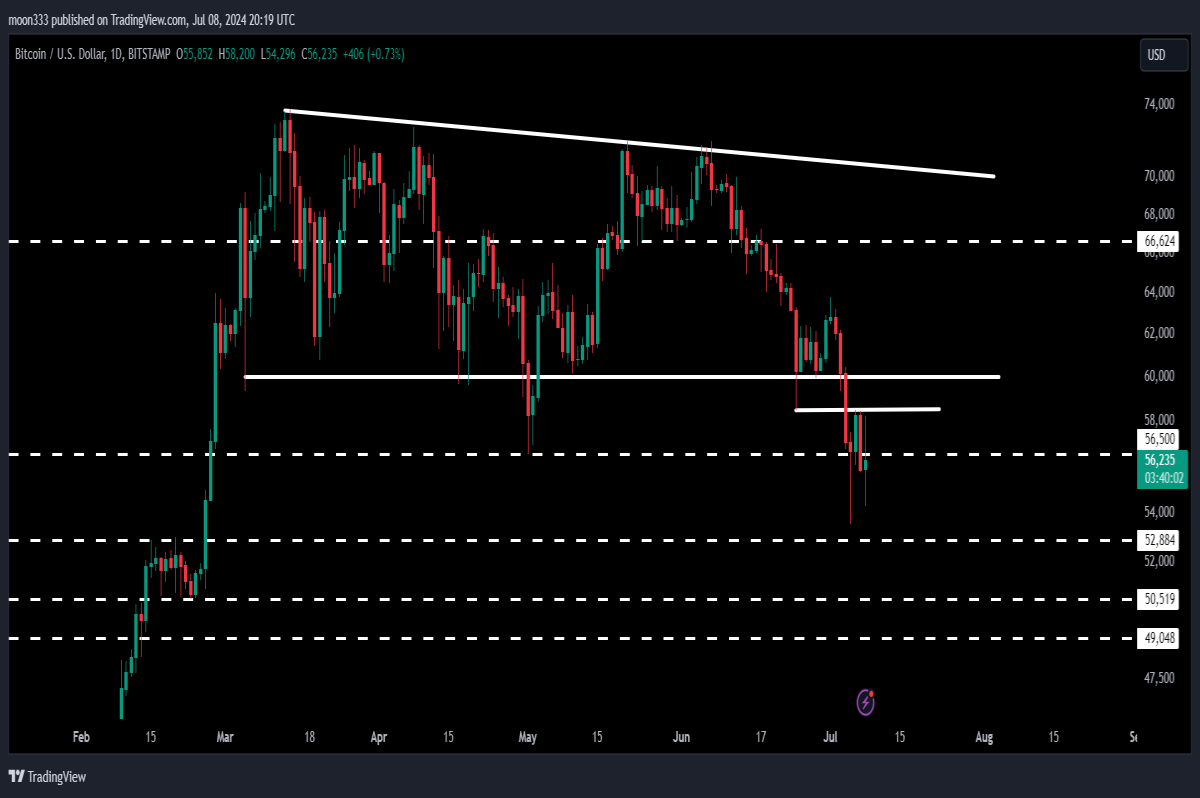
- $58,500 Level: Previously acted as support and now as resistance. Bitcoin has faced rejection here multiple times.
- $60,000 Level: This is a crucial level, previously the support of a descending triangle. Breaking above this could signal a significant bullish move.
Long-term Support and Target
- $56,500 Level: This level has acted as a significant support and resistance point.
- $49,000 Level: The most critical long-term support level. The technical target for the breakdown from the triangle also points here.
Massive Breakout and Up Channel
7-Day Time Frame Analysis
- Falling Wedge Pattern: A massive breakout occurred from this pattern, suggesting a target of approximately $70,000.
- Up Channel Formation: Bitcoin formed a double top and then dropped to the support of this large up channel.
Future Projections
- Resistance Levels: The next significant resistance levels are at $60,000 and $69,000 to $73,000
- Support Levels: Key supports are at $56,500 and $49,000.
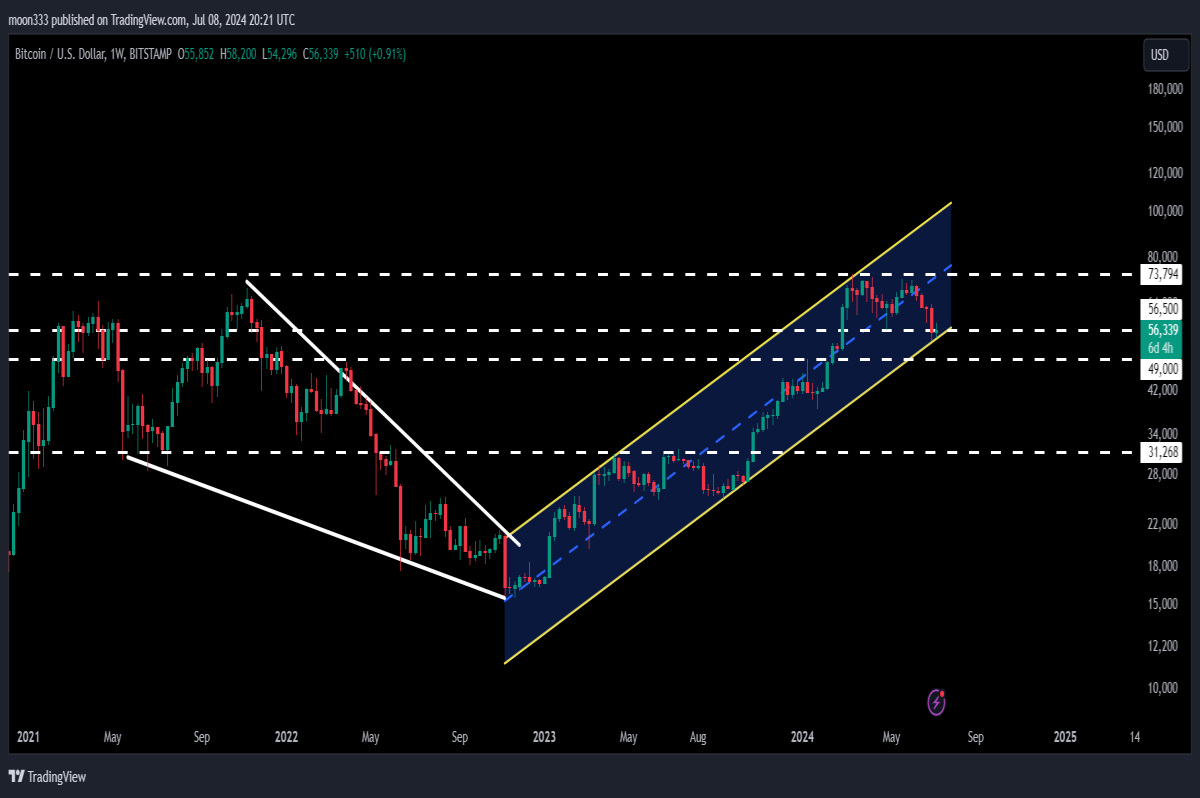
Weekly Time Frame Analysis
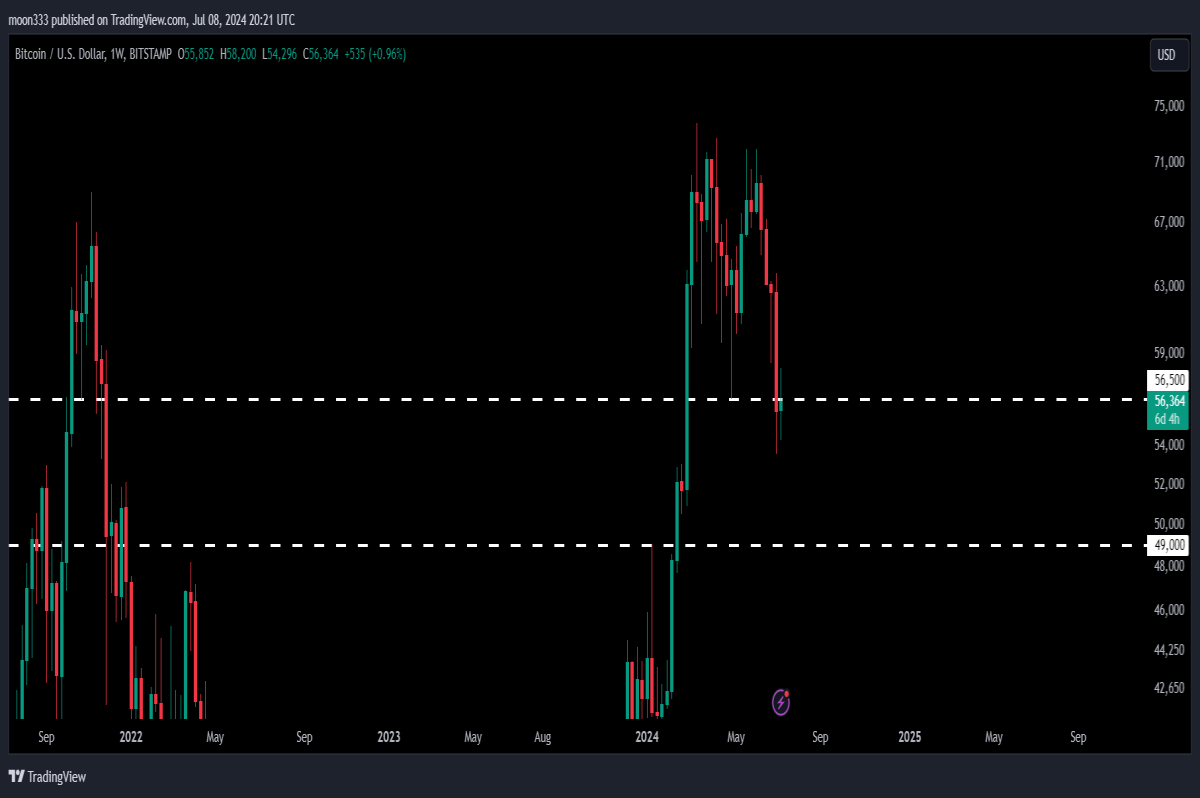
- Falling Wedge Breakout: On the weekly chart, Bitcoin broke out of a big falling wedge pattern and is now testing the support of the rising channel.
- Support Levels: If Bitcoin breaks the $56,500 support, the next critical support is at $49,000.
Conclusion
To sum up, Bitcoin is currently in an important phase with key resistance and support levels in play. Breaking above $60,000 could lead to a significant bullish move, while maintaining the $49,000 support is crucial for avoiding further declines.
If you enjoyed this analysis, please like and follow the blog. For more trading signals, consider joining as a YouTube or Patreon member. The links are provided below:


