
Introduction
Welcome to the latest update on DogWifHat (WIF). In my previous analysis, we covered how WIF has been moving within a down channel. Today, we'll examine the recent price action, potential bearish signals, and key resistance levels.
Recent Price Movements
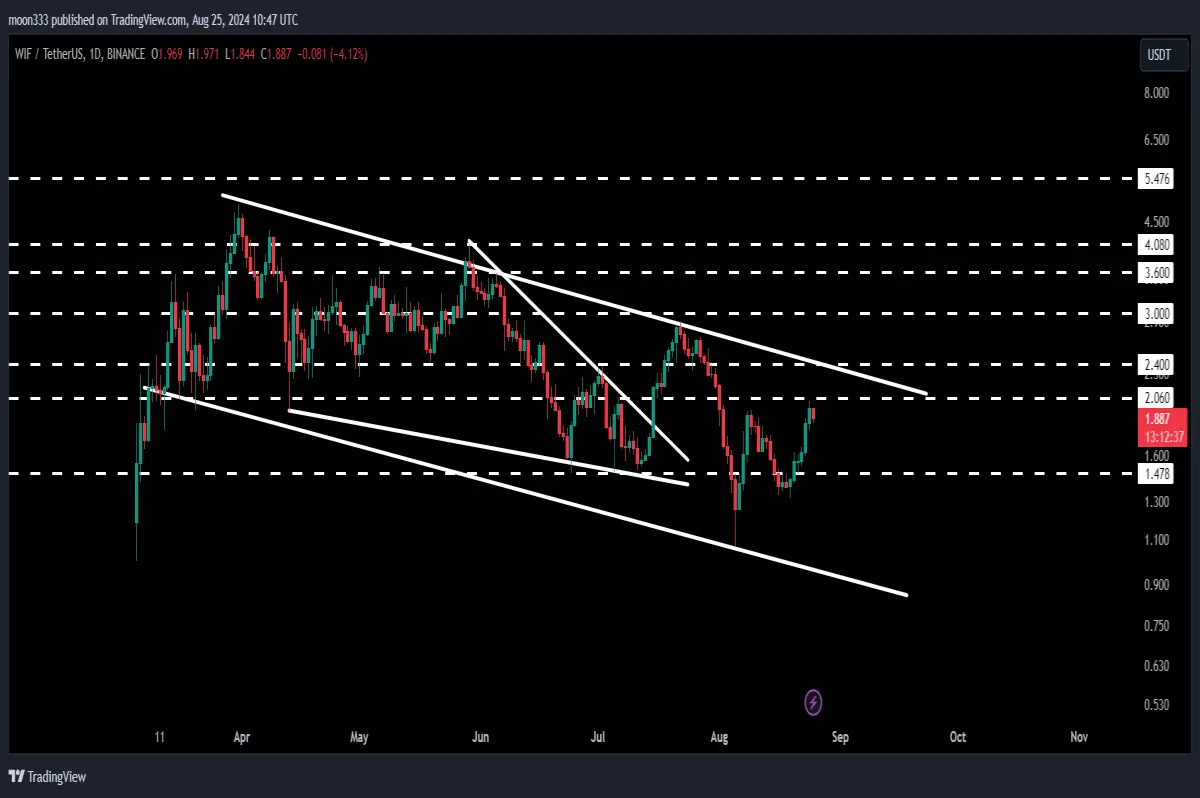
In the daily time frame chart, DogWifHat recently bounced from the support of the down channel. After this bounce, the price initially moved down but is now moving up towards the channel's resistance again. This pattern of bouncing off support and testing resistance is a crucial aspect of our analysis.
Previous Trade Signal Success
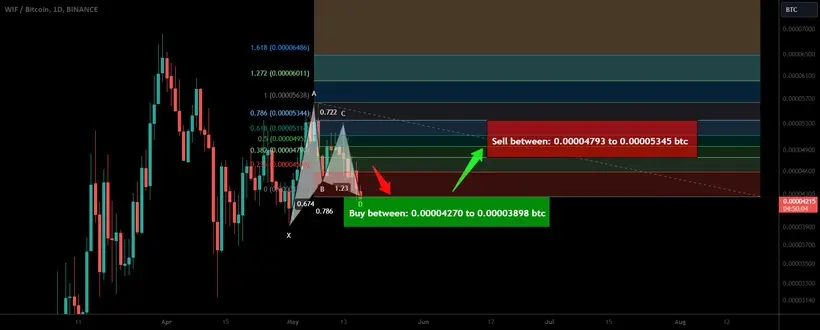
On May 18, 2024, a harmonic bullish reversal pattern was identified for DogWifHat against Bitcoin. The signal resulted in a substantial 53% increase, outperforming the initial target. This success illustrates the effectiveness of these trade signals.
Click here to see this signal on Patreon
For detailed analysis, you can watch the below video:
Technical Analysis of Current Price Action
-
Daily Time Frame: Since March 8, 2024, DogWifHat has been trading inside a down channel. The price has touched the channel’s support and resistance multiple times. After a recent bounce, the price is approaching the channel’s resistance again, which is around $2.6.
-
Falling Wedge Pattern: Within the channel, the price also moved inside a falling wedge pattern. Although it broke out of this pattern, it couldn’t hit the target due to resistance from the downtrend line of the channel.
Resistance and Support Levels
-
Resistance: The price is approaching a significant resistance at $2.6, which previously acted as support. Additionally, the uptrend line resistance from the channel and the long-term resistance at $2.4 are also crucial levels.
-
Support: If the price declines, it might test the support at $1.47. The price has touched this level multiple times, and it could act as support again if the price falls.
Long-Term Targets
-
Falling Wedge Pattern: If the price breaks out of the channel resistance, the target from the falling wedge pattern is approximately $4.
-
Down Channel Target: The technical target for the breakout from the down channel is around $5.
Conclusion
DogWifHat is at a critical juncture, approaching key resistance levels while exhibiting a bearish divergence signal. Traders should monitor the price action closely to see if it can form a higher high and potentially align with oscillator movements. A breakout from the current resistance levels could lead to significant gains, with targets set at $4 and $5.
For more detailed trading signals and updates, consider joining as a YouTube or Patreon member, where regular insights and setups are shared.






