
Introduction
Hey friends, I hope you're well! Welcome to the latest update on DigiByte coin. In my previous videos, I discussed DigiByte's formation of a down channel on the daily time frame chart. Today, we’ll revisit this analysis and explore recent developments, including a significant breakout on the 7-day time frame chart and a long-term trade signal shared last year.
Recent Developments:
Current Chart Analysis
On the daily time frame chart, DigiByte has been struggling to break out of a down channel. In the past few days, the price has been testing the resistance of this channel without a definitive breakout. We will analyze this move and assess potential future actions.

For detailed analysis, you can also watch the below video:
Breakout from the Falling Wedge
On the 7-day time frame chart, DigiByte has recently broken out of a significant falling wedge pattern. This breakout is crucial as it indicates a potential upward trend. I’ll also revisit a long-term trade signal shared on June 6, 2023, which has produced an impressive 300% gain so far.
Long-Term Trade Signal
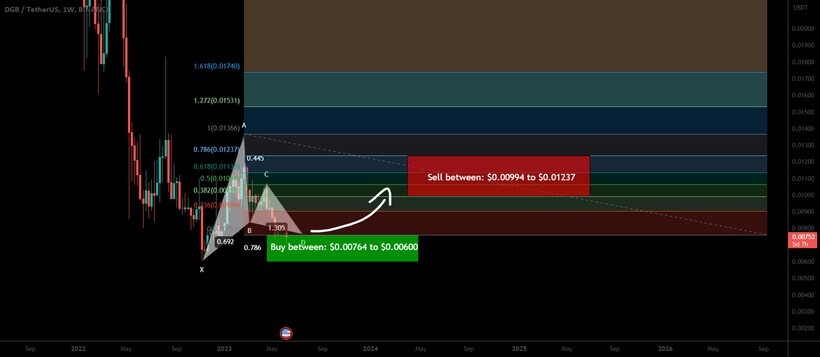
Harmonic Bullish Reversal
In June 2023, I shared a harmonic bullish reversal pattern for DigiByte on the 7-day time frame chart. This pattern led to a remarkable 300% increase. You can view this trade signal and see how it performed in detail on the trading view chart.
Click here to visit this trade signal
Current Market Analysis
Daily Time Frame Chart
DigiByte has been moving within a down channel since March 1, 2024. After reaching resistance on April 1, 2024, the price has struggled to break out. Currently, the price is making another attempt to break the channel's resistance. If the breakout occurs, the technical target is approximately $0.0185. However, if rejected, the price may test support at around $0.045
.
7-Day Time Frame Chart
On the 7-day time frame chart, the 1.85 cents resistance has previously acted as a strong support and resistance level. The breakout from the falling wedge pattern has hit its initial target, but a larger move is anticipated. The long-term target for the biggest falling wedge pattern is around 20 cents.

Conclusion
So far, DigiByte has shown promising signs with its recent breakouts and patterns. For those interested in trading signals and more detailed analysis, consider subscribing to my channel or supporting me as a YouTube or Patreon member. You can find the link to join in the video description.
Thank you for watching, and don't forget to like and subscribe for more updates. Take care, and goodbye!


