
Hello friends! I hope you're doing well. In this article, we’ll dive into the latest update on Cream Finance (CREAM). Previously, I discussed a major breakout that occurred in a symmetrical triangle pattern on the 7-day time frame. Let’s recap that move and explore what’s happening now.
Symmetrical Triangle Breakout and Retest
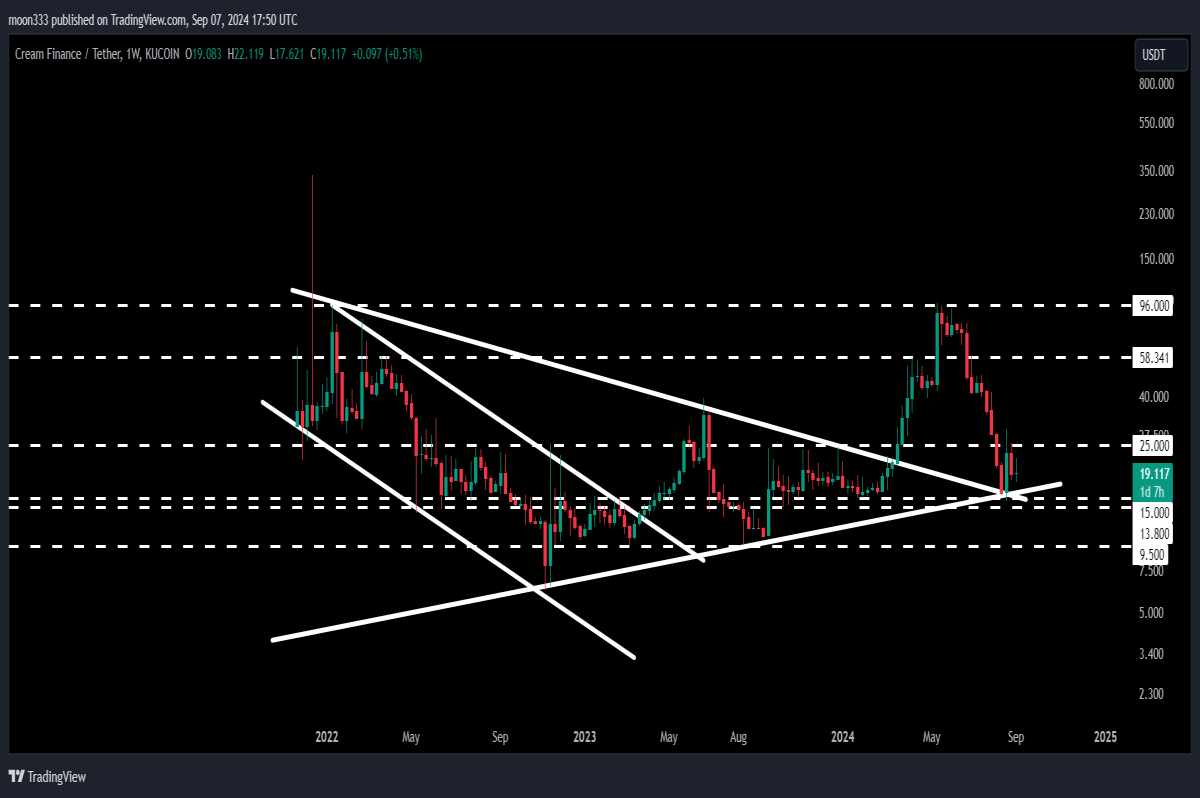
Cream Finance recently experienced a breakout from a large symmetrical triangle on the 7-day chart. Following the breakout, the price surged, but soon after, it retested the down trendline that previously served as resistance of the aforementioned triangle. This line has now flipped into a support level.
I mentioned in my earlier analysis that we could expect a bounce from this support level, and indeed, the price rebounded strongly. However, it was rejected at the $25 resistance level, which has been a critical point for months. This rejection stopped the rally, but the bounce itself was quite substantial.
A 100% Bounce Followed by Rejection
By placing a measurement tool, we can see that the bounce was nearly 98-100%, a significant movement. However, the price failed to break the $25 resistance, a level that had acted as both support and resistance previously. The inability to break this key resistance level has been a notable challenge for CREAM, as it has tested this level multiple times.
Previous Resistance Levels and Trading Signals
Before we dive deeper into the current analysis, if you’re interested in following my trading signals, feel free to join me as a YouTube member or Patreon member. There, I share detailed trading signals with clear entry, exit targets, and stop-loss levels. For instance, in the case of Hook Protocol, you can check the chart directly and see the exact trade setups, including buying and selling targets.
Cream Finance’s Downward Channel and Recent Bounce
Now, let’s return to the live chart of Cream Finance. Previously, I highlighted a downward channel that CREAM had been trading in, and I mentioned that a breakout could lead to a substantial move upward. When CREAM broke out of this channel, the technical target was at $96.
$96 Resistance and Price Drop
After hitting the target of $96, the price was rejected due to a strong resistance at this level. This resistance had been tested previously, and it acted as a major barrier once again. The price has since dropped, but in the past few weeks, CREAM retested the long-term uptrend line support and bounced back.
This uptrend line has been a consistent support level for CREAM since November 2022, providing multiple bounces along the way. We’ve seen another bounce from this line recently, confirming its significance.
Current Focus: Breaking the $25 Resistance
Looking ahead, the next major hurdle is to break the $25 resistance level. This level has repeatedly acted as a barrier to any sustained upward momentum. Only after breaking this level can we expect a more substantial move.
Target for the Symmetrical Triangle Breakout
From a technical standpoint, the breakout from the symmetrical triangle has already resulted in a strong pump. Using the measurement tool, we can see a rise of 365%, and if we measure from the October 2022 low, the price increase is an impressive 1,465%.
The long-term target for this breakout could reach as high as $500, offering significant upside potential for CREAM investors.
Conclusion
In summary, Cream Finance has experienced a major breakout, retesting key support levels, and continues to face the $25 resistance level. If it manages to break this barrier, we could see another substantial rally. Keep an eye on the $500 long-term target, as it may come into play if the technical levels hold.
For more updates and trading signals, you can join me on Patreon or YouTube as member. Thanks for reading, and stay tuned for more updates!


