
Introduction
Welcome to the latest update on TIA Coin. In previous analyses, we discussed TIA's movement within a long-term down channel and the formation of a descending triangle. In this article, we will explore the current price action within these patterns and potential breakout scenarios.
TIA Coin's Current Patterns: Descending Triangle and Down Channel
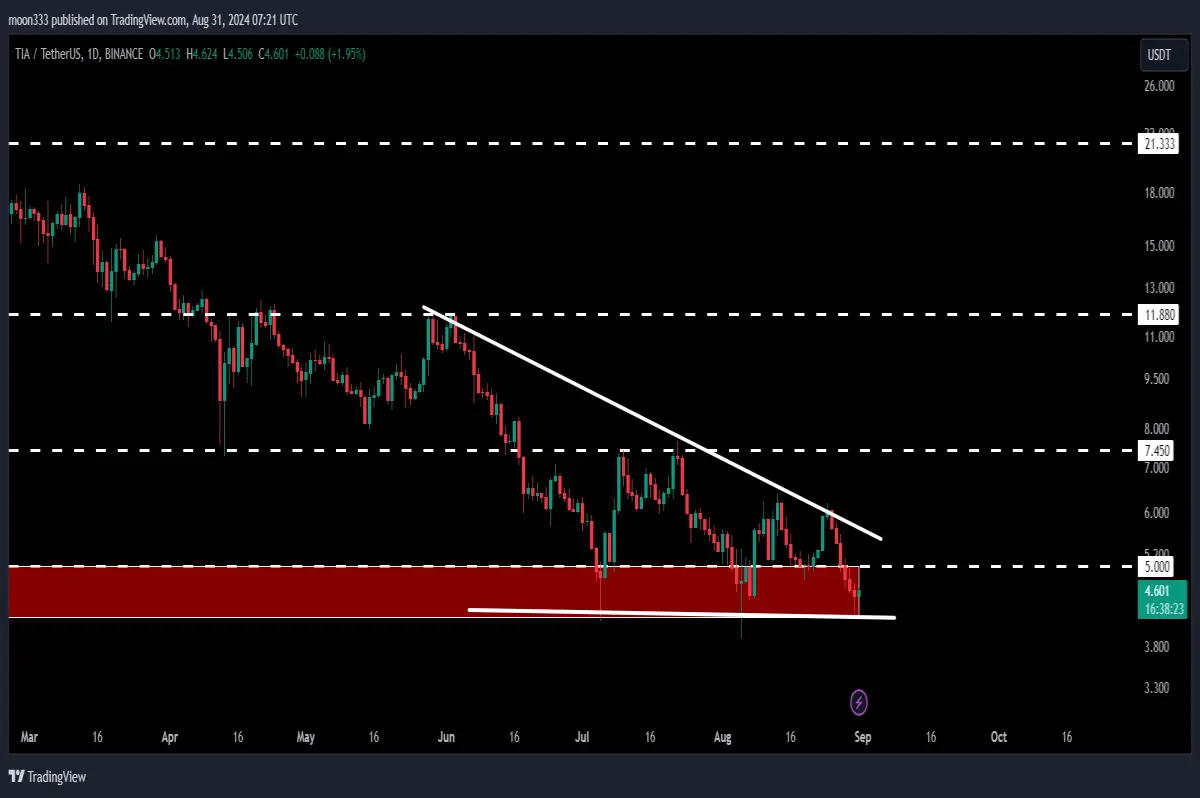
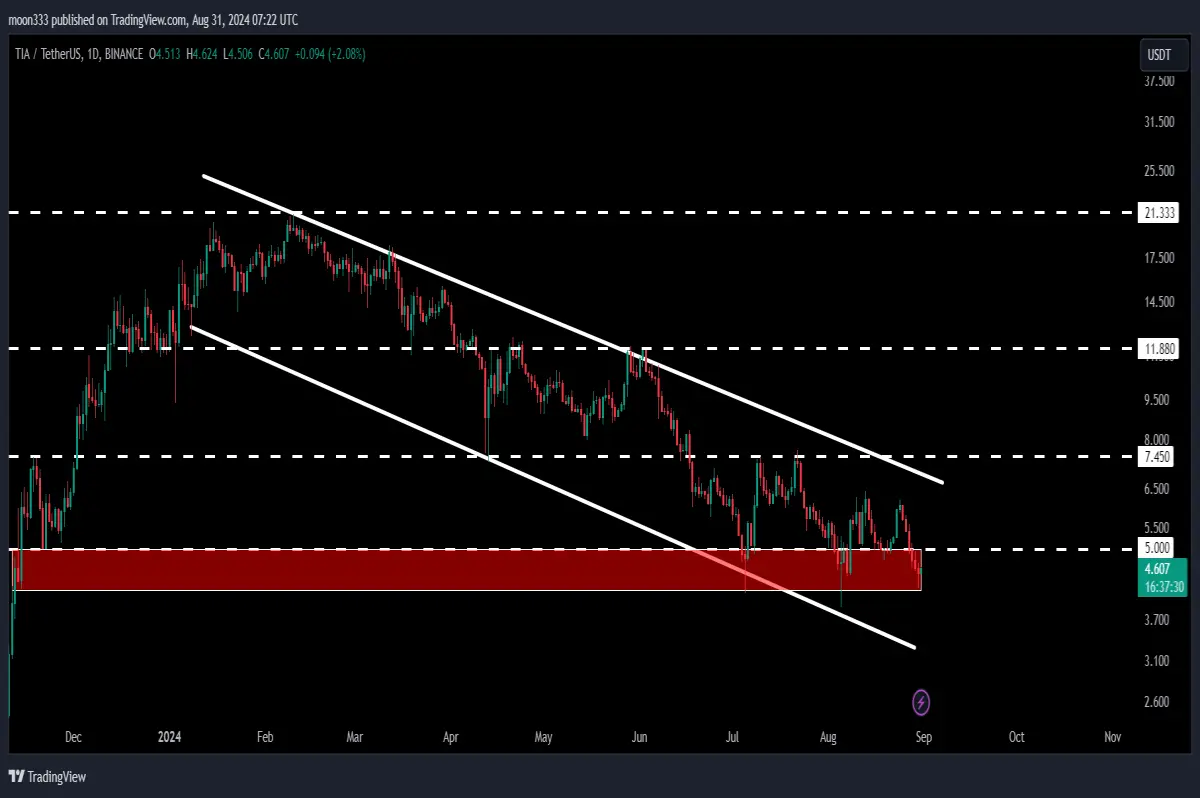
TIA has been trading inside a long-term down channel on the daily timeframe. Alongside this channel, the price has formed a descending triangle, indicating a possible squeeze in the price movement. The resistance and support lines of the descending triangle are converging, suggesting that a breakout might be imminent.
Technical Analysis: Key Support and Resistance Levels
The descending triangle's support is currently aligning with a long-term support zone between $5 and $4.20, which has historically provided strong support during previous downtrends. This zone has acted as a critical level, with the price bouncing off it multiple times in the past.
As the price continues to squeeze within the descending triangle, traders should watch closely for a breakout. If TIA breaks down from this triangle, the technical target could be as low as $1.67. Conversely, a breakout to the upside could target $14, which might also lead to a breakout from the long-term down channel.
Potential Breakout Scenarios
If TIA manages to break out of the descending triangle to the upside, it could also break through the resistance of the down channel. The technical target for this potential breakout would be the top of the channel, around $21. This would represent a significant move and could signal the beginning of a new bullish phase for TIA.
Conclusion
TIA Coin is currently at a critical point, trading within a descending triangle and a long-term down channel. A breakout in either direction could lead to substantial price movements. Traders should keep an eye on key levels, as the next few days could be pivotal for TIA's price action.
For more trading signals and updates, consider supporting the channel as a YouTube or Patreon member. Stay tuned for further analysis and insights.






