
Introduction:
In this analysis, we'll dive into the recent price movements of Celer Network (CELR), focusing on the patterns that have developed on both the daily and weekly timeframes. We'll explore potential breakout scenarios and key levels to watch.
Daily Time Frame: Movement Within the Down Channel
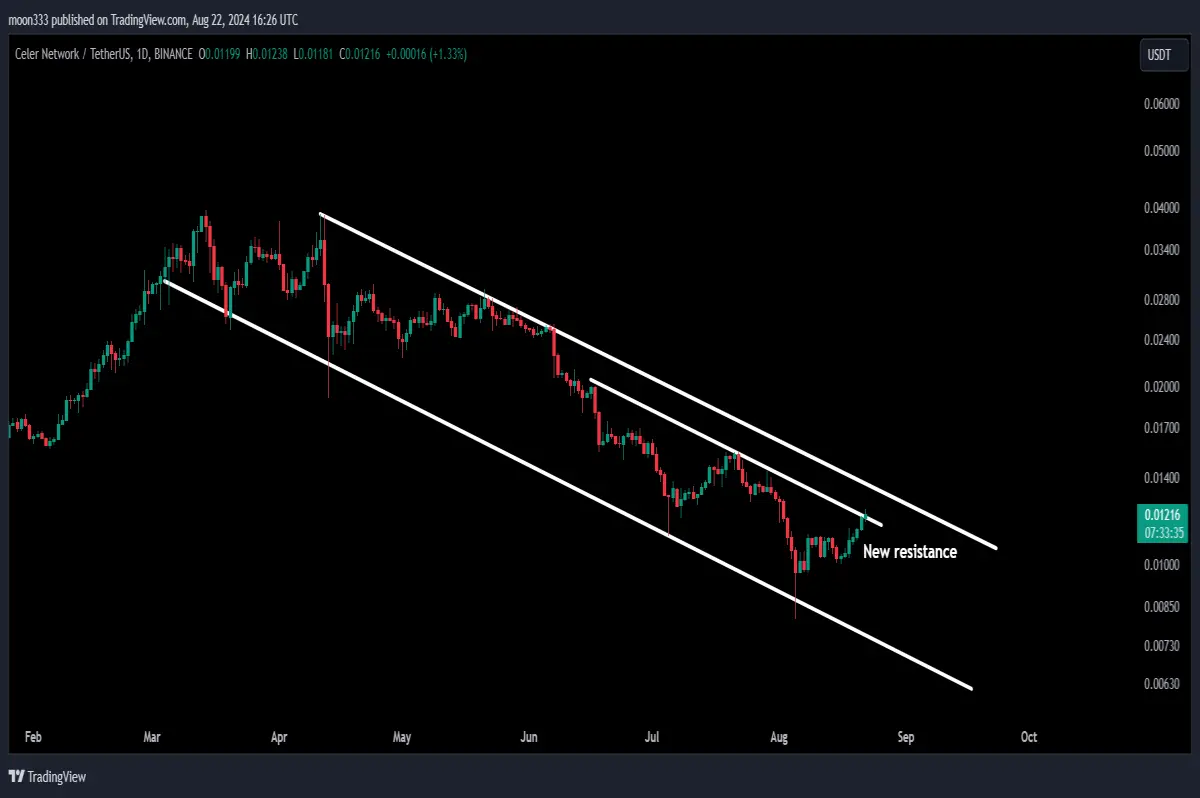
Celer Network has been trading within a down channel on the daily timeframe since March 2024. This channel was established after the price found support on March 6, 2024, and encountered resistance on April 11, 2024. Since then, CELR has been oscillating between these two levels.
Recently, CELR has been attempting to break through a secondary downtrend resistance that started on June 18, 2024. This resistance has been tested multiple times but has yet to be decisively broken. If CELR manages to break through this resistance, an immediate move toward the channel's upper boundary is likely.
For detailed analysis, you can watch the below video:
Key Resistance and Support Levels
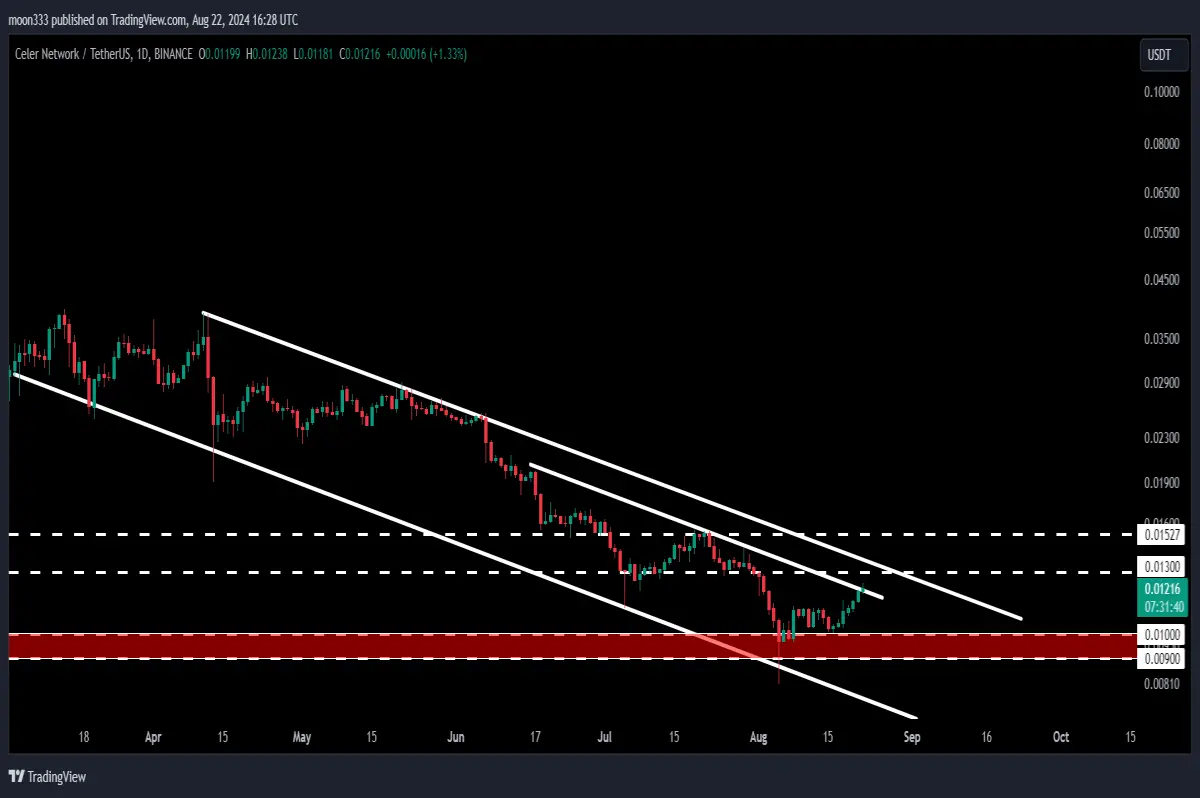
Upon breaking the downtrend resistance, the next target would be the upper boundary of the down channel. However, this resistance aligns with another significant long-term resistance at 1.3 cents. The confluence of these resistance levels could create a strong barrier for CELR.
On the downside, if CELR fails to break out, it may revisit the support zone between $0.01 to $0.009. This support zone has proven to be quite resilient, holding firm in previous instances, including a recent bounce in early August 2024. If CELR drops back to this level, breaking below it would be challenging, given its historical strength.
Weekly Time Frame: Massive Falling Wedge Breakout
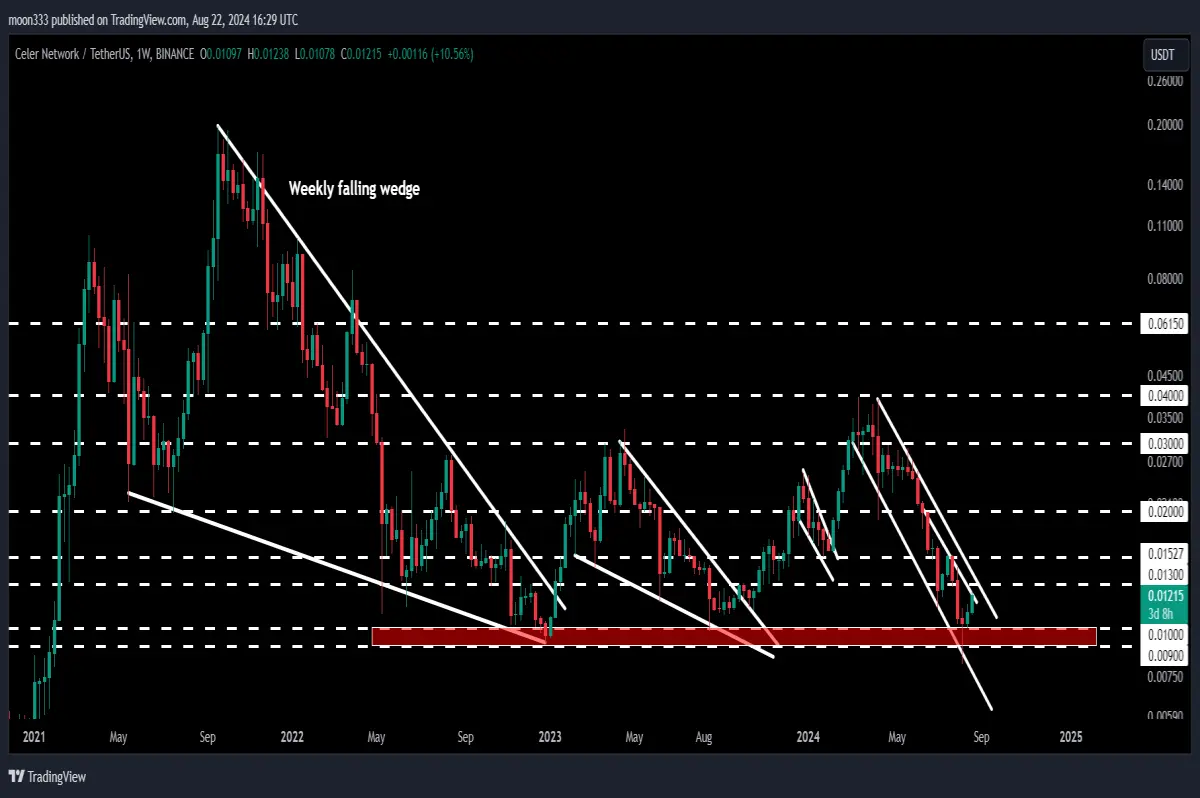
On the 7-day (weekly) timeframe, CELR has already experienced a significant breakout from a long-term falling wedge pattern. This breakout is a bullish sign, indicating the potential for a substantial upward move.
The target for this breakout is around 20 cents, which represents a considerable gain from the current price levels. However, before CELR can reach this target, it must overcome intermediate resistance levels, particularly the 4-cent level, which has served as both support and resistance in the past.
Conclusion
Celer Network is at a critical juncture, with the potential for a significant move depending on whether it can break through key resistance levels. Traders should closely monitor the downtrend resistance on the daily chart and the 1.3-cent resistance level. A successful breakout could lead to a move toward 4 cents and eventually toward the long-term target of 20 cents following the weekly falling wedge breakout.
For those interested in detailed trading signals and analysis, consider joining as a member or patron, where exclusive content is shared regularly. Stay tuned for more updates, and happy trading!






