
Bitcoin Price Analysis: Massive Up Channel and Elliott Wave Structure
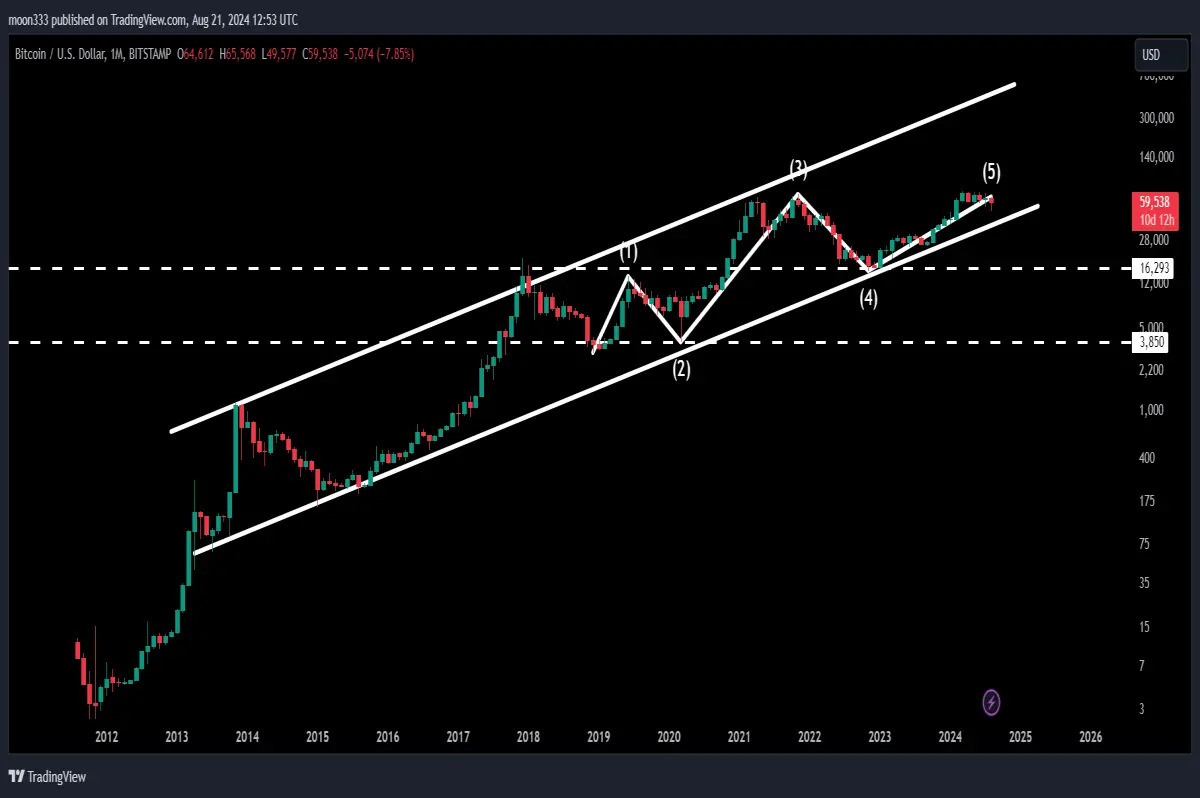
Bitcoin has been moving within a significant up channel on the monthly time frame, and in this analysis, we'll delve into its current position and potential future movements. The leading cryptocurrency is not only following this uptrend but has also formed a massive cup and handle pattern and is completing a very large Elliott wave structure.
Overview of the Monthly Time Frame
Looking at the live monthly time frame chart, we can see that Bitcoin has been steadily progressing within this long-term up channel since 2013. The Elliott wave structure being formed is notable, with the following waves:
- Wave 1: Impulsive wave
- Wave 2: Correction wave
- Wave 3: Another strong impulsive wave
- Wave 4: Correction wave
- Wave 5: Currently in progress, potentially the longest and most significant wave
Two crucial trend lines are drawn at the bottom of wave 4 and wave 2, and notably, wave 4 does not overlap with wave 1. This adherence to the Elliott wave principle suggests a strong and continuing bullish trend.
For detailed analysis you can also watch the below video from my channel:
The Cup and Handle Pattern
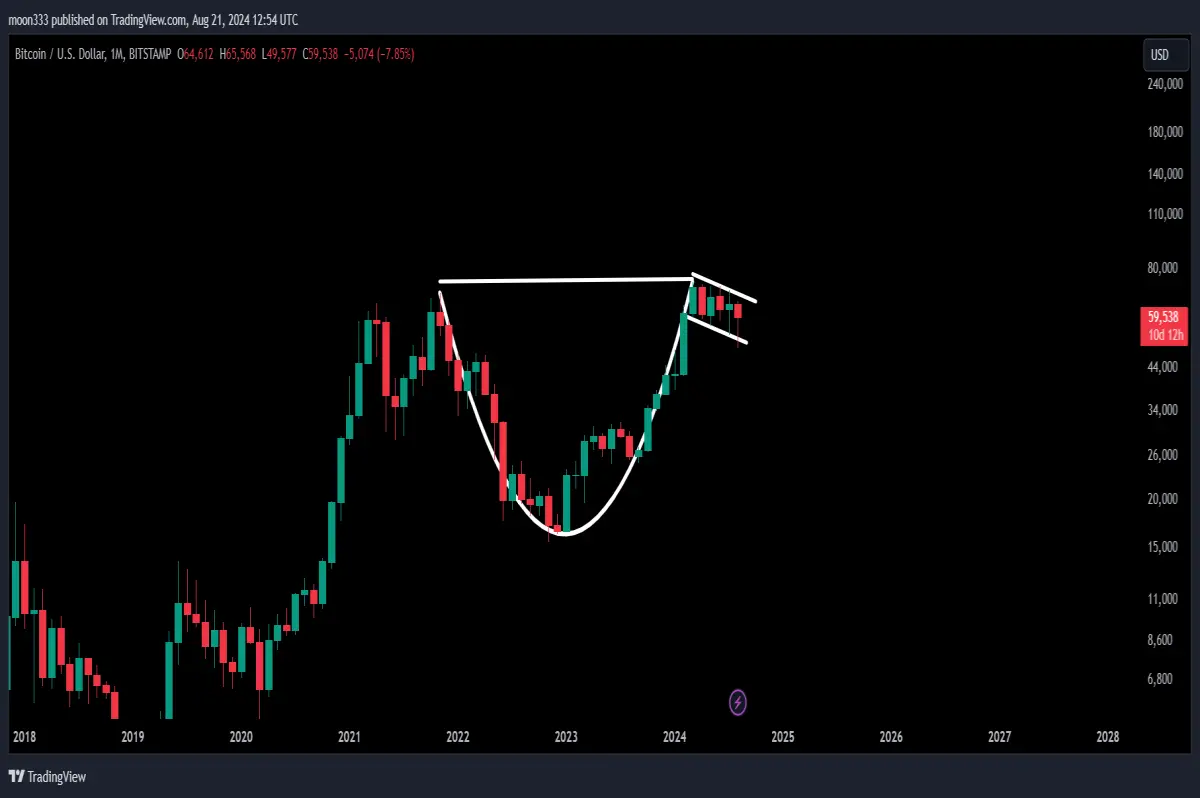
In addition to the Elliott wave structure, Bitcoin has also formed a massive cup and handle pattern on the same time frame. This is a bullish continuation pattern, where the price line is completing the handle.
- Cup Formation: The round-shaped body represents the cup.
- Handle Formation: The handle is being formed near the resistance line.
A breakout from the handle's resistance could lead to a significant price surge. The technical target from this breakout could be between $380,000 and $400,000, or if it reaches the resistance of the up channel, it could potentially hit around $500,000.
Potential Price Movements
Before Bitcoin can reach these lofty heights, there may be a rejection at the resistance of the channel, which could occur somewhere between $100,000 and $125,000. If this happens, we might see an ABC correction wave, where the price could touch the resistance of the channel once again during the C wave.
Conclusion
Bitcoin's price movement within this up channel, coupled with the completion of a large Elliott wave structure and a massive cup and handle pattern, suggests that we could be on the verge of a significant price increase. However, caution is advised, as a rejection at the channel's resistance could lead to a correction before any further upward movement.
For more detailed trading signals and to support this analysis, you can join as a YouTube or Patreon member. Links are shared as below.
Stay tuned for further updates and analyses!






