
Introduction
Hey friends, this is Val, and welcome to the latest update on Bitcoin. In my previous articles, I discussed two Elliott Wave structures of Bitcoin—one on the daily time frame chart and the other on the 4-hour timeframe chart. Let's dive into the recent developments and analyze the potential future movements of Bitcoin.
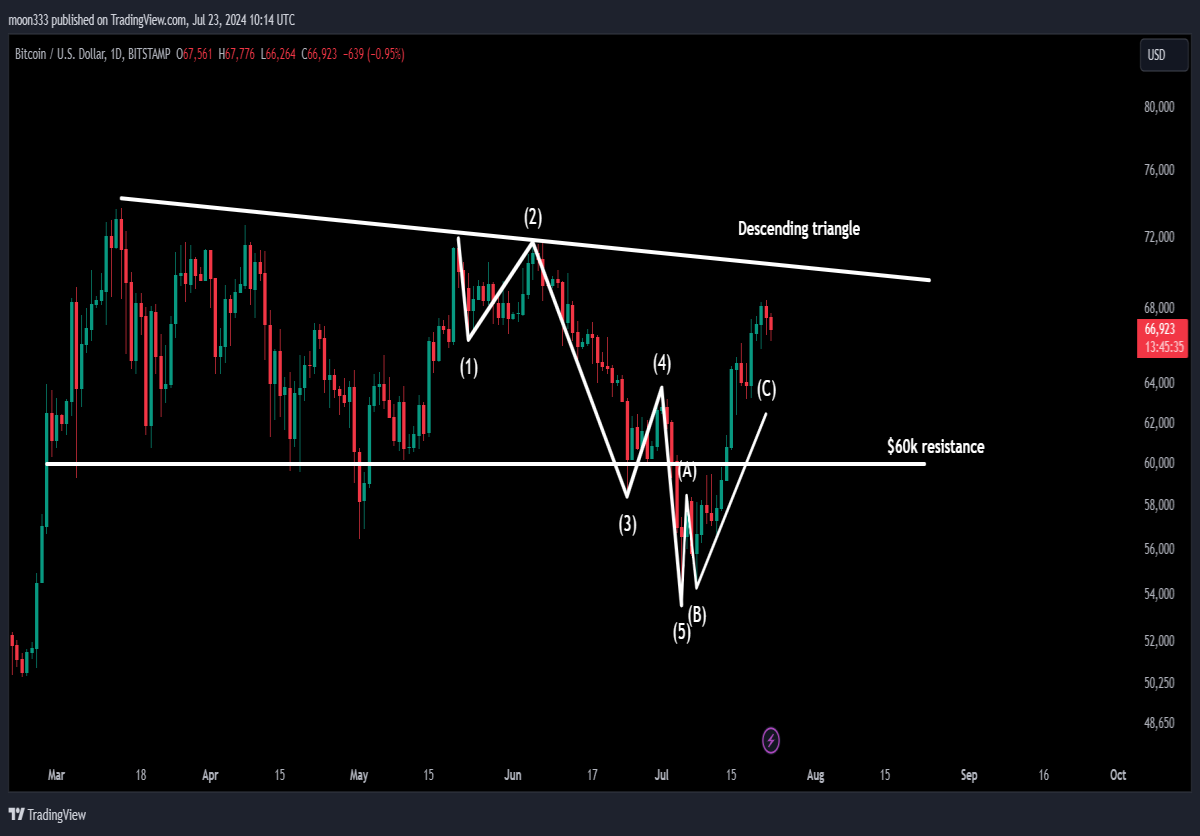
Daily Timeframe Analysis:
On the daily time frame chart, Bitcoin completed a five-wave structure. I mentioned that if Bitcoin breaks the resistance at $60,000 during the formation of the C- correction wave, the trend could shift from downwards to upwards, halting the larger downtrend. As anticipated, Bitcoin broke the $60,000 resistance, previously a support level in a descending triangle.
For detailed analysis, you can watch the below video:
4-Hour Timeframe Analysis
Simultaneously, on the 4-hour timeframe chart, Bitcoin completed another five-wave Elliott Wave structure:
- Wave 1: Impulsive wave
- Wave 2: Correction wave
- Wave 3: Longest impulsive wave
- Wave 4: Correction wave
- Wave 5: Current wave
I previously suggested that during the formation of Wave 5, Bitcoin could potentially break the next resistance levels.
Potential Targets for Wave 5
- If Wave 5 equals the length of Wave 1, Bitcoin could hit the $69,000 resistance.
- If Wave 5 equals the length of Wave 3, Bitcoin might even surpass the highest price of March 2024, aiming for $76,976.
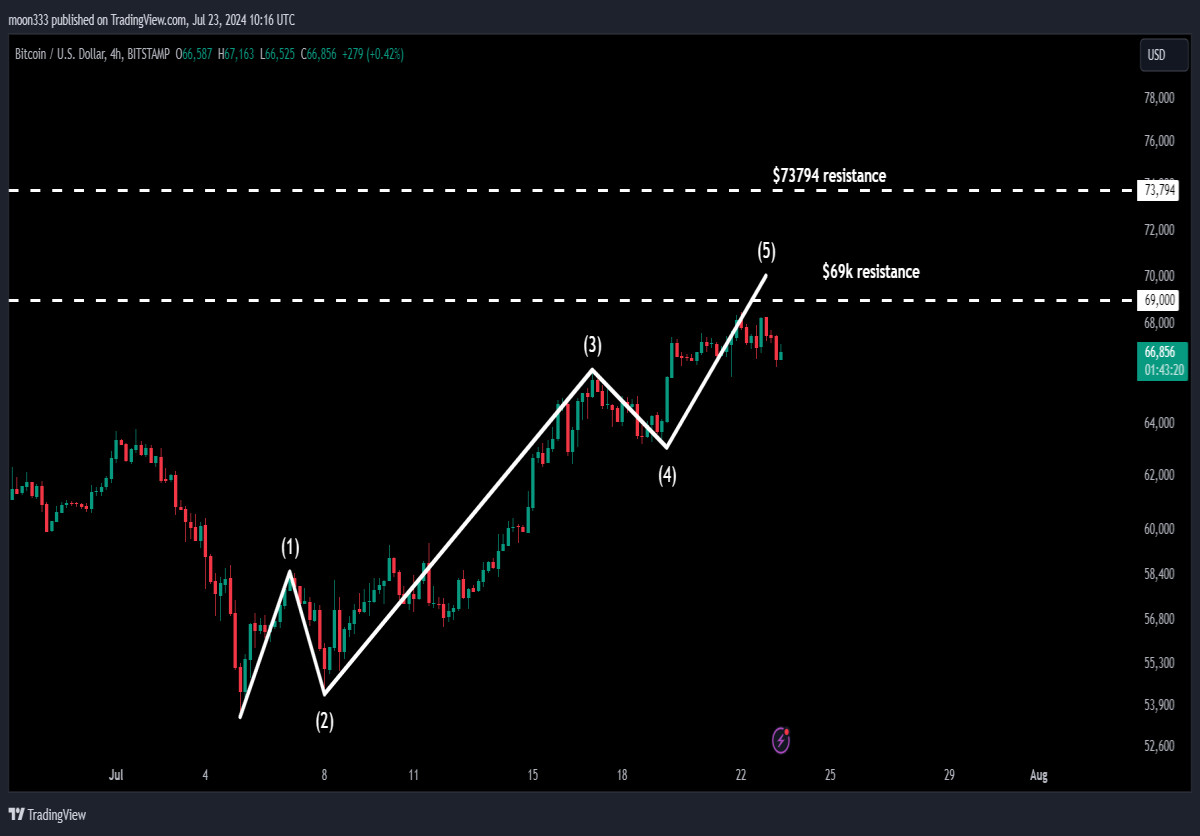
Current Market Situation
The formation of Wave 5 has begun, bringing Bitcoin close to the $69,000 resistance, which is also the highest price of the previous bull run in November 2021. A breakout from this level could also break the descending triangle resistance, leading to a significant rally.
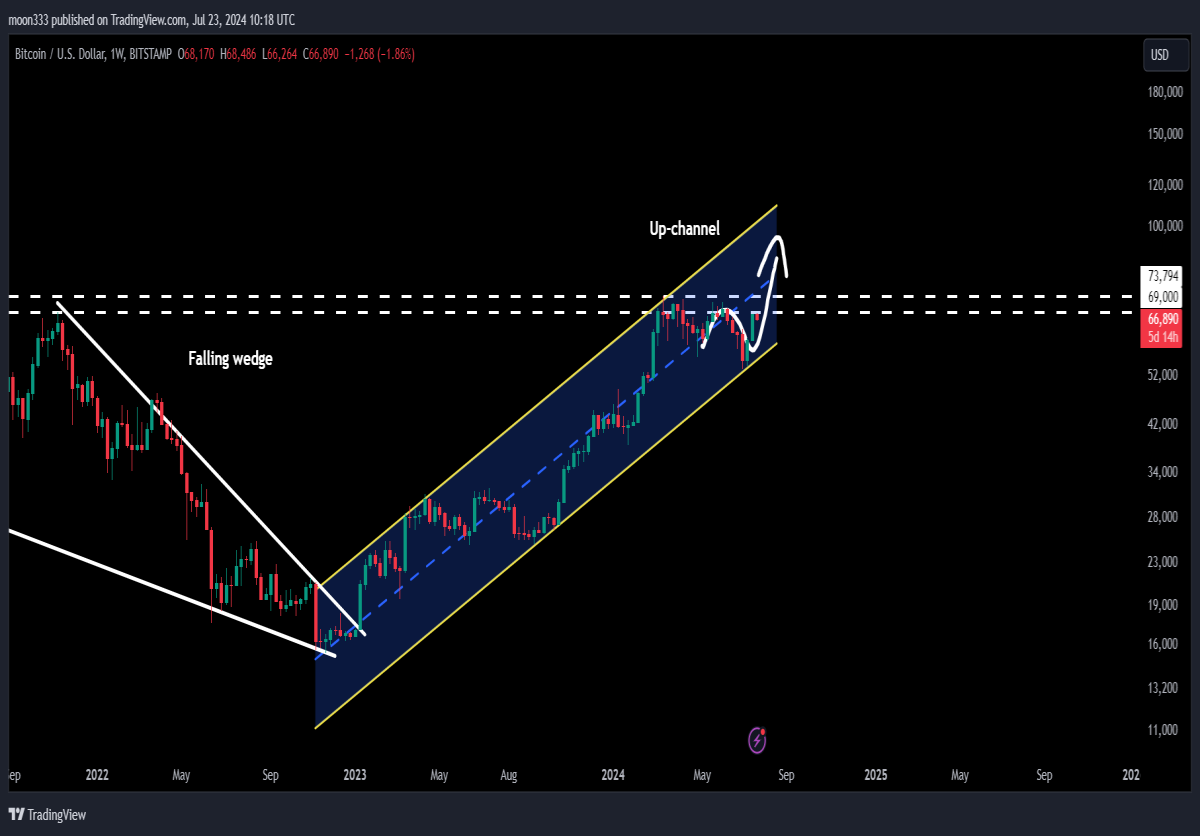
Analyzing Long-Term Patterns
Falling Wedge Pattern
In earlier videos, I highlighted a long-term falling wedge pattern on Bitcoin’s chart. The technical target for this breakout is around $77,000. Bitcoin has already rallied beyond this target and recently bounced from the support of an ascending channel.
Weekly Time Frame Chart
On the weekly chart, Bitcoin has broken out from a large falling wedge pattern but faces strong resistance between $69,000 and $73,794. This area previously formed a double top. A breakout from this resistance could lead to a rally towards the next target, approximately at $100,000.
Conclusion
The current Elliott Wave structures suggest potential bullish movements for Bitcoin, with key resistances at $69,000 and $73,794 . A breakout from these levels could lead to substantial gains, possibly reaching $100,000. Stay tuned for more updates, and consider following my blog for detailed analysis.
For more trading signals, join me as a YouTube member or a Patreon supporter. Links are provided as below. Take care and goodbye!


