
Hey friends, hope you're well! Welcome to the new update on Bitcoin. In today's article, I will show you Bitcoin wave analysis on the monthly timeframe chart.
Bitcoin's Upward Channel
On this monthly timeframe chart, you can see that Bitcoin is moving in a very nice up channel. We have observed several rejections and touchpoints at both the support and resistance levels of the channel. The price is currently moving very close to the support of the channel after multiple bounces off  this support.
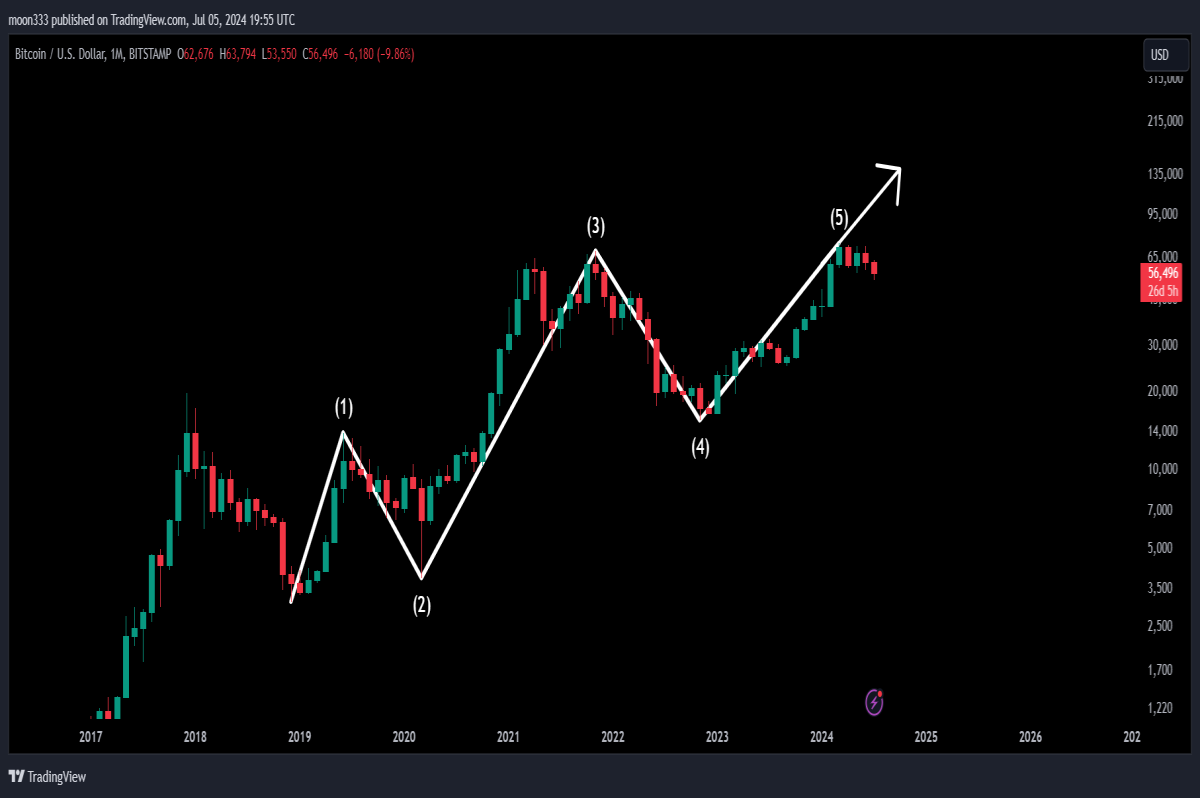
Elliott Wave Analysis
Now, let's take a look at the Elliott Wave analysis on this monthly timeframe chart. We have:
- Impulsive Wave 1
- Corrective Wave 2: This wave does not retrace more than 100% of Wave 1.
- Impulsive Wave 3: The longest wave, rallying beyond the expected 1.618 Fibonacci level of Wave 1.
- Corrective Wave 4
- Impulsive Wave 5: This wave is still higher than Wave 3 but not as high as expected. Wave 3’s rally exceeded expectations, so Wave 5 might be slightly longer than usual.
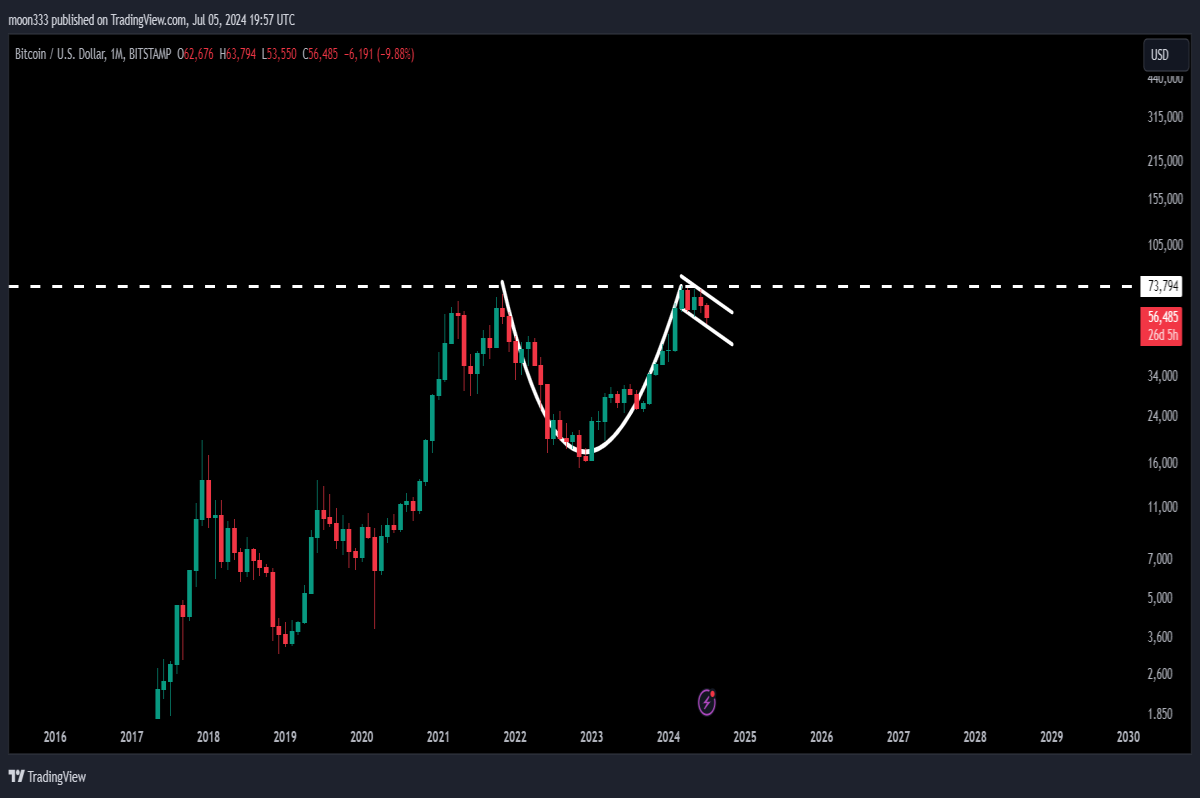
Cup and Handle Formation
There is also a potential cup and handle formation on this monthly timeframe chart. The handle is currently being formed, and the retracement level for this handle could be between 38.2% to 50% of the body of the cup. A significant support level at $48,000 might be tested before any further upward movement.
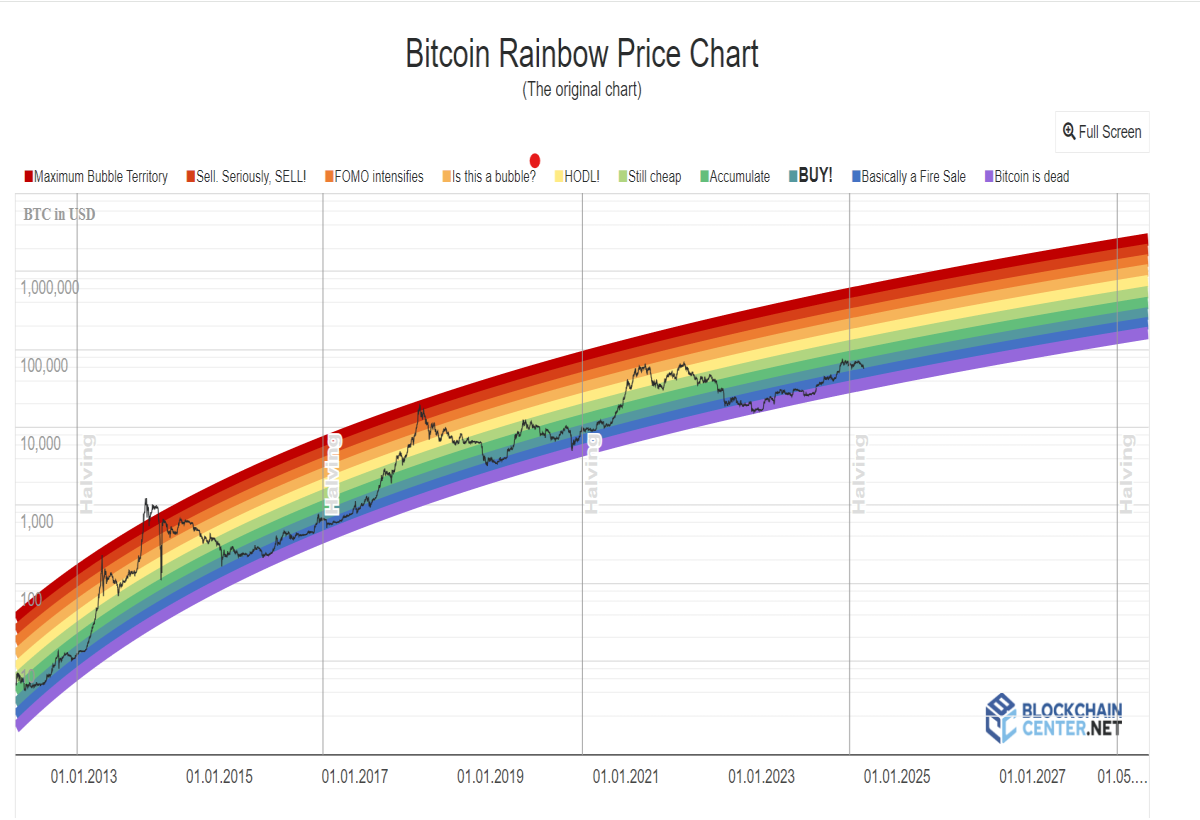
Bitcoin Rainbow Chart
The Bitcoin Rainbow Chart shows that after every halving, Bitcoin tends to form a higher high and enters the red zone. This has happened consistently after previous halvings. However, after the latest halving, Bitcoin has not yet entered this red zone, suggesting a potential for future upward movement.
Detailed Chart Analysis
Let's move to the live chart analysis. On this monthly timeframe chart:
- Wave Structure: We observe Wave 1, Wave 2, Wave 3, Wave 4, and currently, Wave 5. It’s important to note that Wave 3 is longer than Wave 1, and Wave 5 might be slightly longer but not exceed Wave 3.
- Cup and Handle: This large formation might lead to a significant breakout. The handle is forming, and retracement to around $48,000 is possible before the next upward move.
- Technical Target: If Bitcoin breaks out from the handle and the cup’s resistance, the technical target could be around $310,000. However, this might be challenging since Wave 5 should be shorter than Wave 3.
Conclusion
The Bitcoin Rainbow Chart suggests a continued potential for upward movement, reinforcing the wave analysis. Historically, after each halving, Bitcoin hits the red zone. This pattern might repeat, indicating higher prices in the future.
I hope you liked the analysis. If you did, hit the like button and follow the blog. For more trading signals, you can join and support me as a YouTube or Patreon member, where I share different trading signals. The links are as below:


