
Introduction
Hey friends, this is Atif Akbar, and welcome to the new update on Bitcoin. In this update, we will analyze Bitcoin's movement on the monthly time frame, focusing on a massive channel pattern, Elliott Wave structure, the Bitcoin rainbow chart, and Bitcoin halving cycle profits.
Massive Channel on Monthly Chart
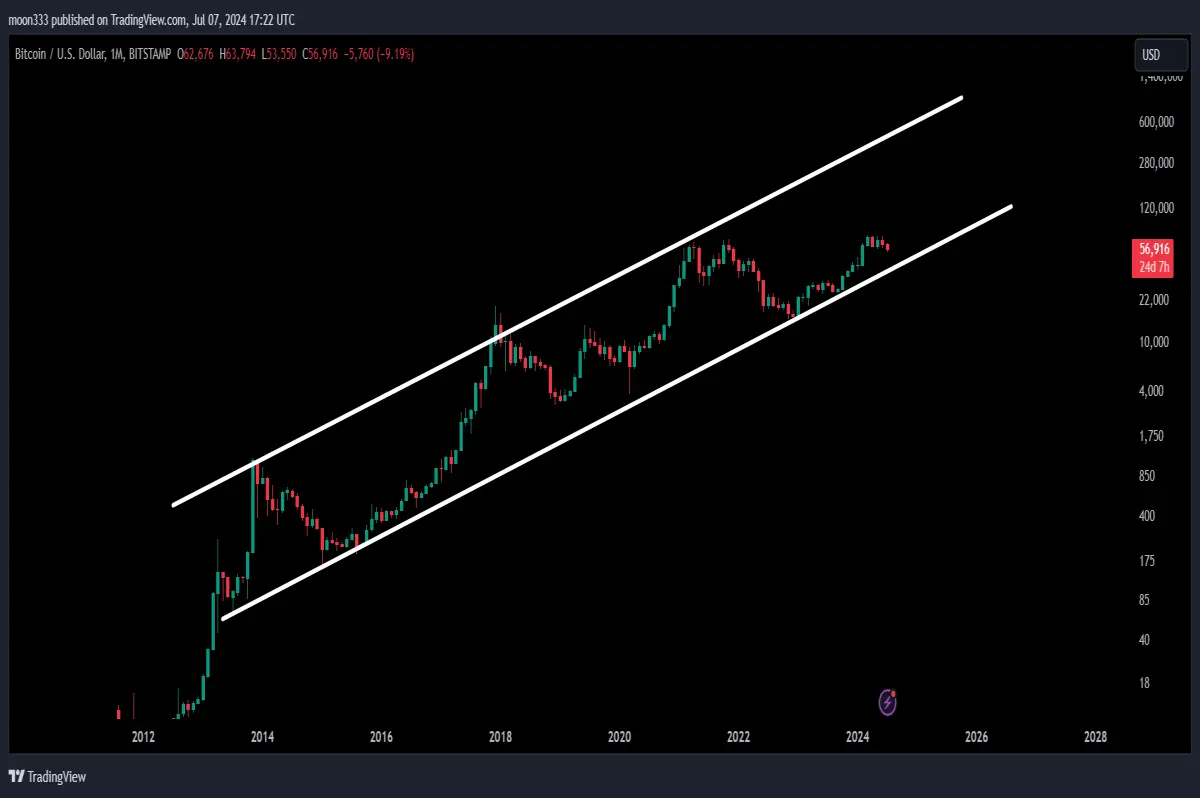
Bitcoin has been moving inside a very massive channel since November 2013. This channel has several key rejection points:
- Rejection Points: We experienced rejections at various points, including March 2020, which nearly touched the support but then saw a massive rally.
- Support Bounces: The support has been tested multiple times, indicating its strength.
Currently, Bitcoin is moving close to the support of this channel, indicating a potential critical point for future price action.
Elliott Wave Structure
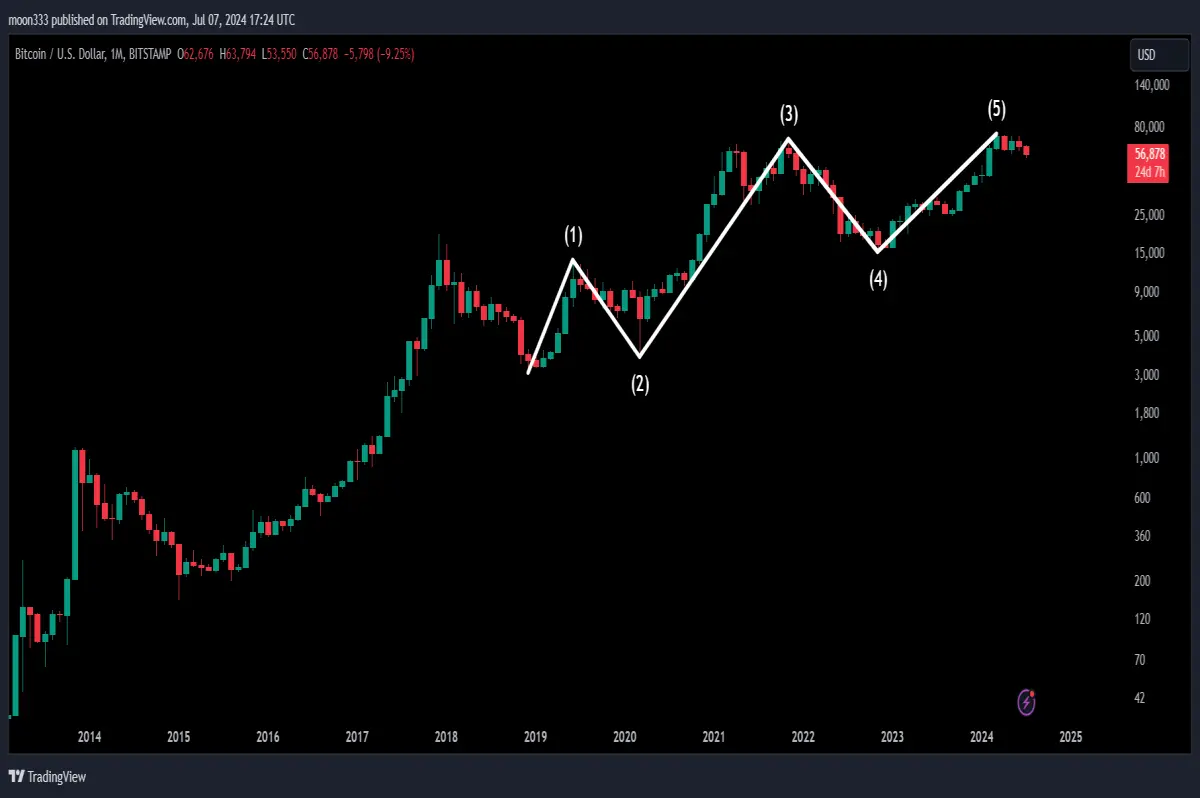
Bitcoin is also following an Elliott Wave structure:
- Wave 1: The initial impulsive wave.
- Wave 2: The corrective wave.
- Wave 3: The longest impulsive wave, exceeding the 1.618 Fibonacci extension of Wave 1.
- Wave 4: The corrective wave that did not enter the territory of Wave 1.
- Wave 5: The current wave, potentially forming a cup and handle pattern.
For detailed analysis you can also watch the below video:
Cup and Handle Formation
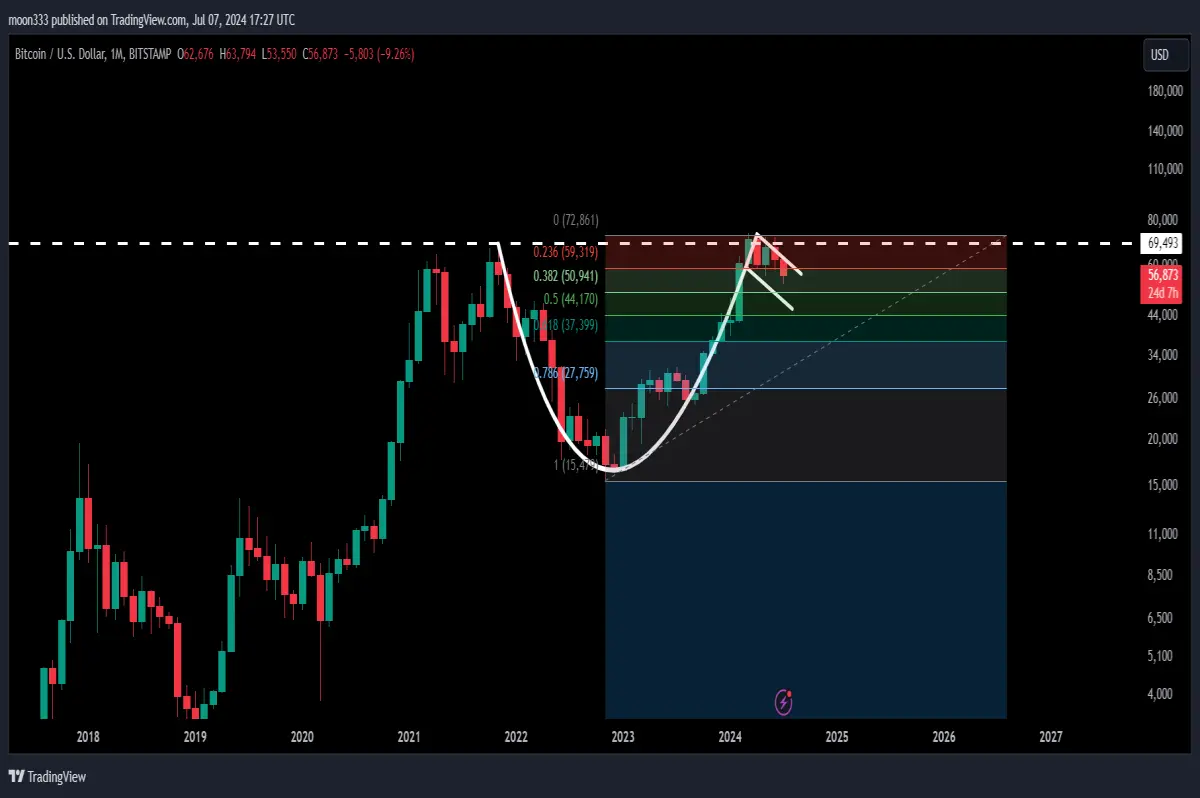
Bitcoin's current movement resembles a cup and handle pattern:
- Cup Formation: A long, rounded shape.
- Handle Formation: If the price drops, it may retrace up to 50% of the cup's body, potentially between $52,000 to $45,000.
Technical Targets and Projections
Cup and Handle Breakout
If Bitcoin breaks out from the cup and handle pattern:
- Target: The technical target could be between $368,000 and $400,000. However, this target may be too optimistic in the short term, as it would invalidate Wave 5 by making it larger than Wave 3.
Key Support and Resistance Levels
- Short-Term Support: $49,000, a significant level previously acting as strong resistance.
- Long-Term Resistance: Approximately $73000, which must be broken out to sustain the rally.
Bitcoin Halving Cycle Profits
Analyzing Bitcoin halving cycles shows consistent patterns of significant rallies following halving events:
- Halving 2016: Led to a powerful rally.
- Halving 2020: Also resulted in a substantial rally.
Currently, we are post-halving, and historical patterns suggest that Bitcoin may see another significant move upwards before reaching the profit-end period around March or April 2025.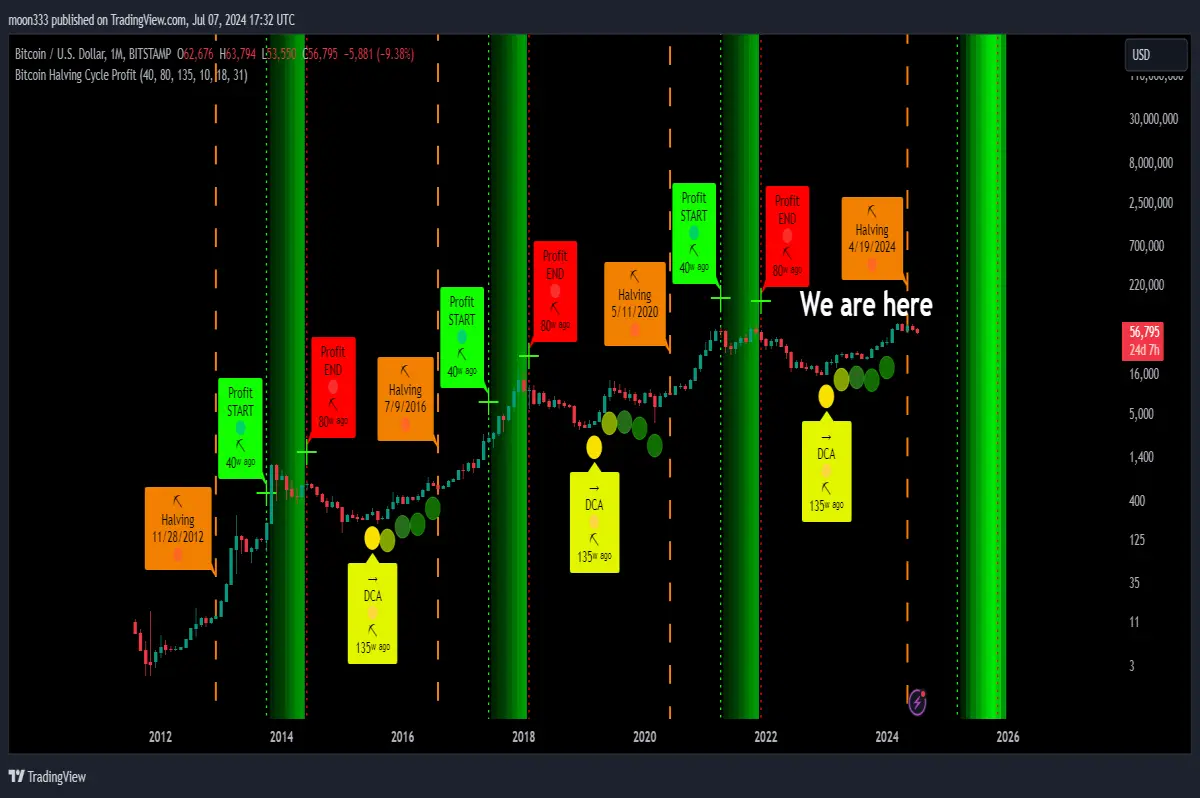
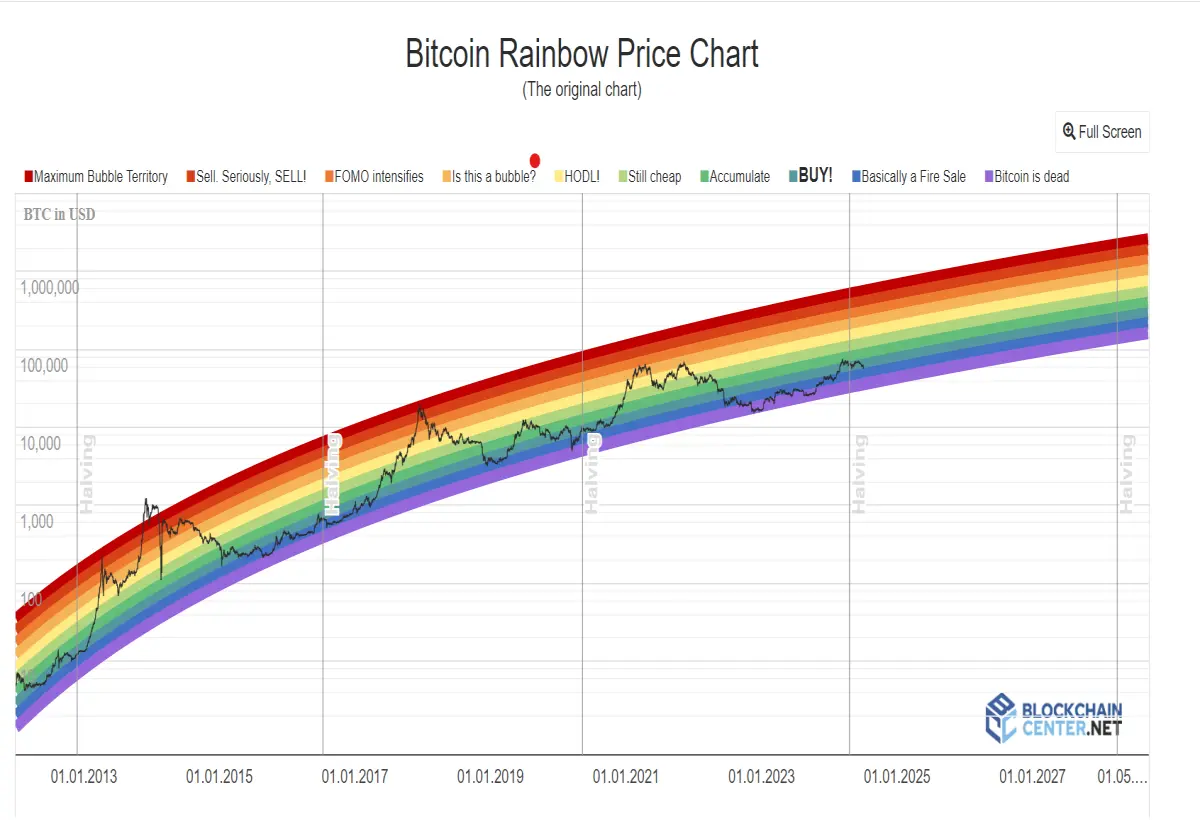
Bitcoin Rainbow Chart
The Bitcoin rainbow chart provides another perspective:
- Red Zone: After each halving, Bitcoin tends to hit the red zone, indicating a peak.
- Current Position: We have just crossed the halving period, suggesting a potential upward move towards the red zone in the future.
Conclusion
Bitcoin is at a critical juncture, with several key patterns and cycles indicating potential future movements. In the short term, we may see a drop to complete the handle of the cup formation, potentially down to $49,000. In the longer term, the Elliott Wave structure and historical patterns suggest a substantial rally could be on the horizon.
I hope you liked this analysis. Do hit the like and follow the blog for more updates. For more trading signals, you can join me as a YouTube or Patreon member, where I share various trading signals. The link to join are as below:






