
Introduction
Hello, friends! Welcome to the latest update on CHR. In my previous videos, I discussed how CHR initially broke out of a significant falling wedge pattern on a 7-day timeframe chart, leading to a substantial rally. However, the price recently entered a new falling wedge pattern on the daily chart. In this update, we’ll analyze the recent price movements, the potential of a new downtrend, and future projections for CHR.
Recent Breakout and Rejection
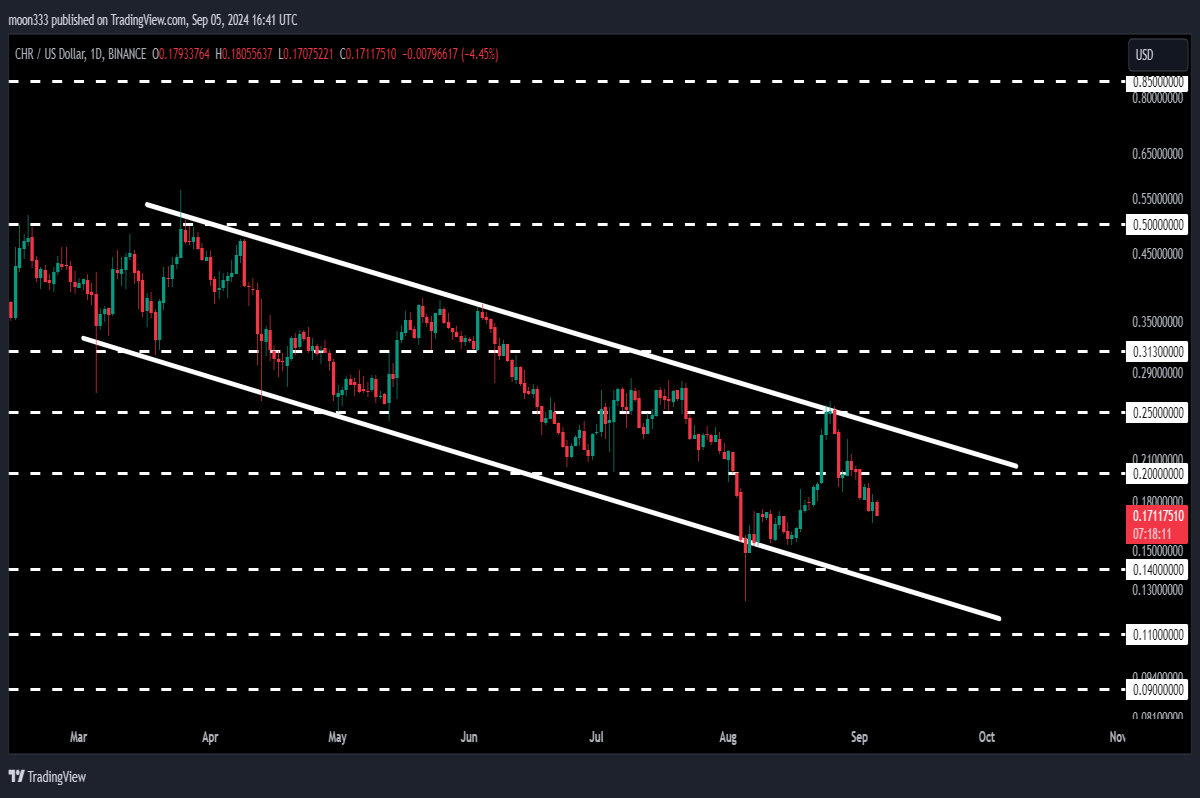
Recently, CHR broke out of the falling wedge pattern on the daily timeframe chart. However, this breakout turned out to be a false breakout as the price faced rejection at the 25-cent long-term resistance and re-entered the falling wedge pattern. We can now adjust the trend line to better reflect the current pattern, which appears to be more of a downward channel than a falling wedge.
Analysis of the Downward Channel
In today’s analysis, we'll focus on this newly formed down-channel. The price has been moving within this channel and recently faced rejection near the channel's upper resistance. If the price continues to bounce off the channel's support, it could confirm the formation of a wider downward channel. Currently, the price is testing the support zone at 14 cents, which has previously acted as a strong support level.
Historical Performance and Resistance Levels
Previously, after the breakout from the falling wedge on the 7-day timeframe chart, CHR experienced a significant 581% rally. Despite this massive gain, the price struggled to break out of the 50-cent resistance, leading to another period of consolidation within the downward channel.
On the daily chart, the price has encountered several rejections at various points, including the 68-cent resistance. Despite multiple attempts, the price could not break through this level and was eventually pushed back into the channel.
Key Support and Resistance Zones
Currently, CHR is testing the support zone at 14 cents, which has been a reliable support level in the past. If the price fails to hold this support, it might test the next support level around 12.8 cents. On the upside, breaking out of the downward channel could lead to a test of the 50-cent resistance, a significant level due to its previous role as both support and resistance.
Weekly Timeframe Analysis
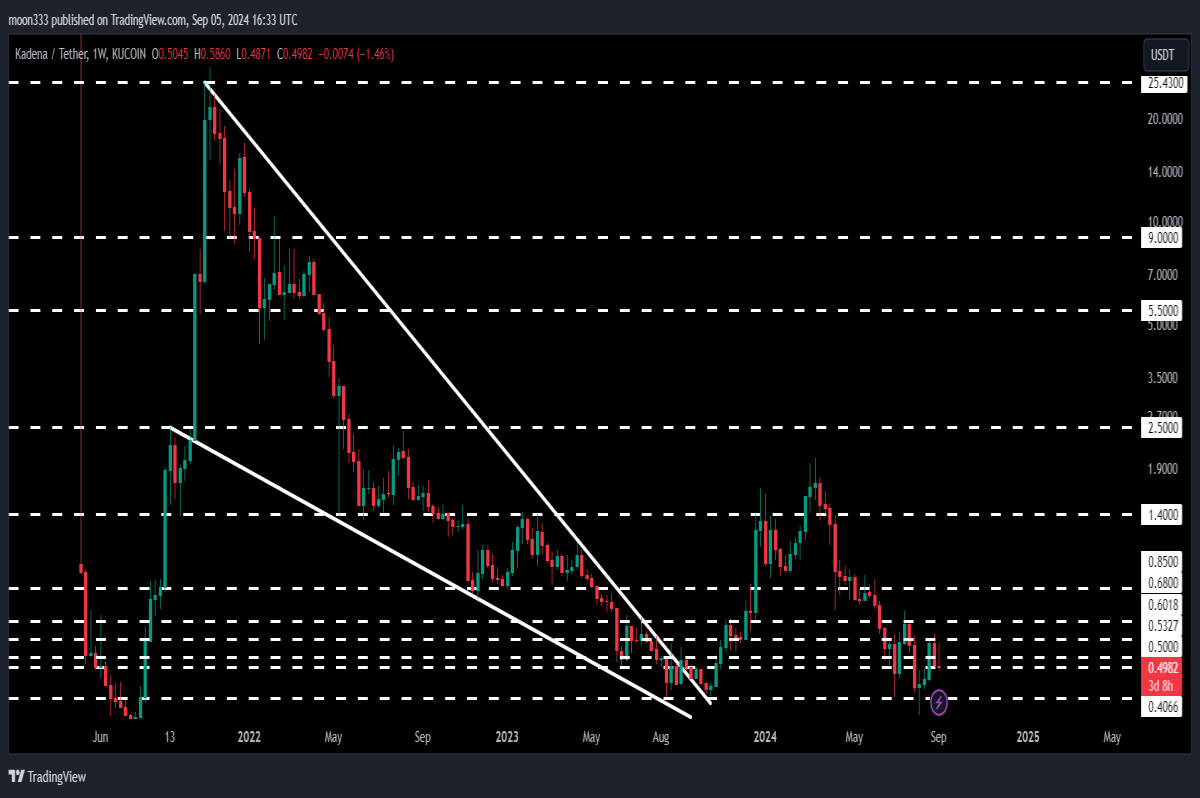
On the weekly timeframe chart, CHR previously broke out of a major falling wedge pattern, leading to a substantial rally. However, the price has faced resistance at the 50-cent level, which has been a key resistance point for several months. For CHR to continue its upward movement and test higher targets, it must break through this resistance level.
Long-Term Target
The long-term technical target for CHR, based on the breakout from the falling wedge pattern, is between $1.50 to $2. Achieving this target will depend on overcoming the current resistance levels and maintaining upward momentum.
Conclusion
That’s the latest update on CHR’s price action and future projections. If you found this analysis helpful, please like the article and subscribe to the blog for more updates. For additional trading signals and support, consider joining my YouTube or Patreon membership, where I share detailed trade setups and signals.


