
About ARK:
ARK is a program that gives a suite of tools to develop ecosystem of blockchains with inter-operability. This project uses Proof-of-Stake (DPoS) consensus algorithm which is delegated.
ARK's network is equipped by delegates, appointed by ARK token holders and their voting. ARK has ability to connect external blockchains using 'SmartBridges'.
Technical Analysys of ARK's price action:
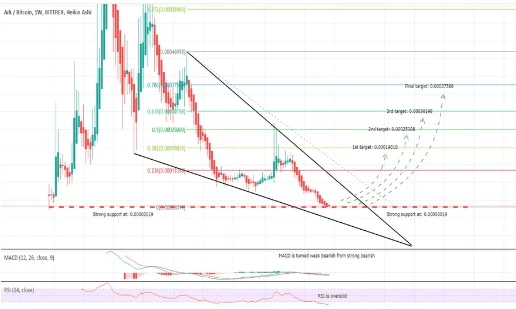
On week chart the priceline of ARKBTC cryptocurrency is moving within a pennant .
We have support at 0.00003019 sats above the pennant support and price action has already hit at this support and now likely to gear up soon Insha Allah.
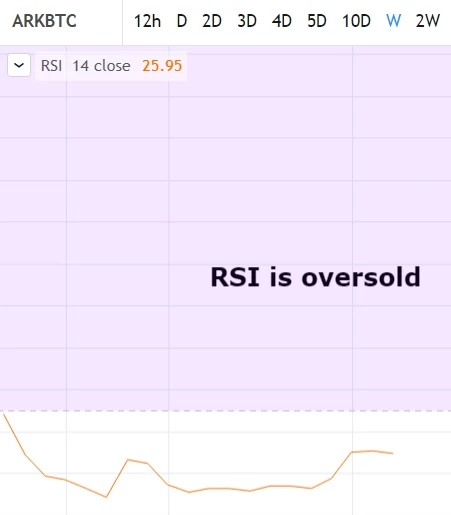
RSI is oversold since May 2019.
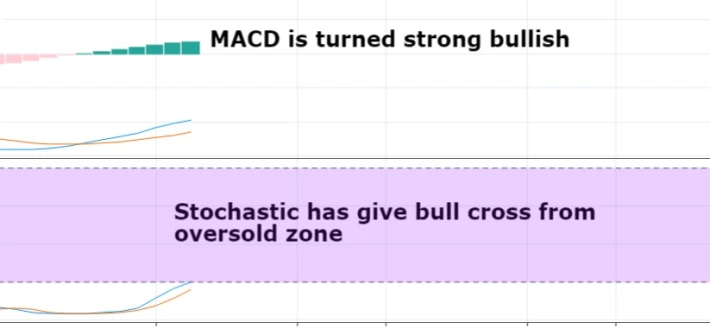
MACD is turned strong bullish.
Stochastic has give bull cross from oversold zone.
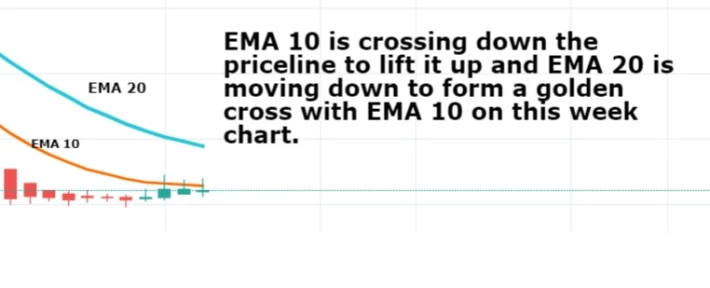
EMA 10 is crossing down the priceline to lift it up and EMA 20 is moving down to form a golden cross with EMA 10 on this week chart.
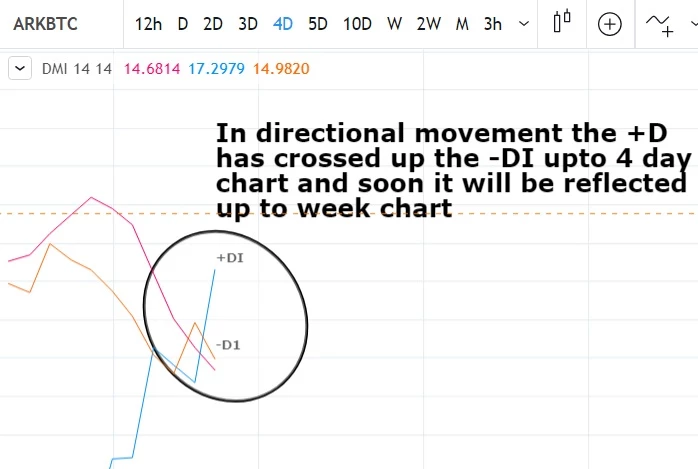
In directional movement the +D has crossed up the -DI upto 4 day chart and soon it will be reflected up to week chart.
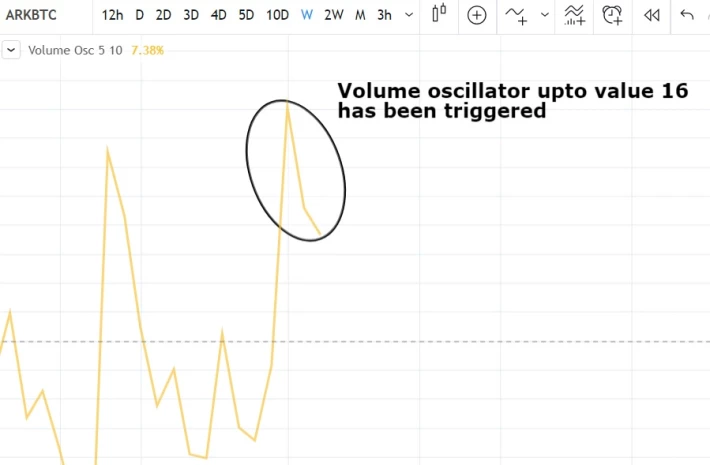
Volume oscillator upto value 16 has been triggered.
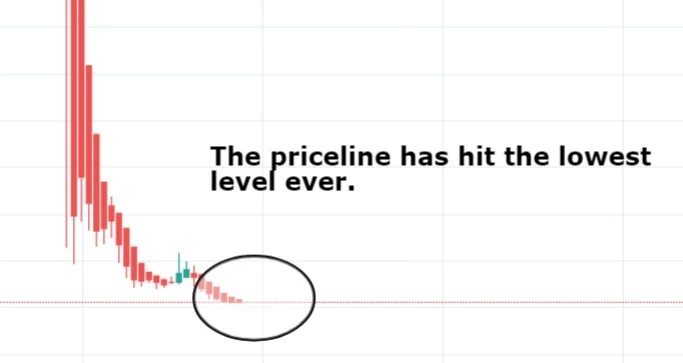
The priceline has hit the lowest level ever.
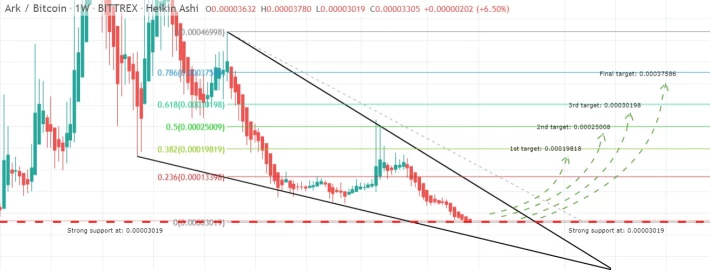
After applying the Fibonacci calculation method on complete price action from tail of the pennant up to the support the targets are as below:
1st target: 0.00019818
2nd target: 0.00025008
3rd target: 0.00030198
Final target: 0.00037586
Regards,
Atif Akbar (moon333)
Disclaimer: Every word of above article is purely result of my personal research and work you can share it using my reference moreover the information contained in this article is for education purpose only, this is not intended to be investment advice, so please seek a duly licensed professional for investment advice.






