
Introduction
In this update, we dive into the recent price movements of PEPE, focusing on critical patterns and potential breakout points. Previously, PEPE had broken out of a significant inverse head and shoulders pattern and a long-term uptrend line resistance, which we covered in earlier analyses. Now, let's take a closer look at the latest developments on the daily and weekly timeframes.
Breakdown and Recovery of Uptrend Line Support
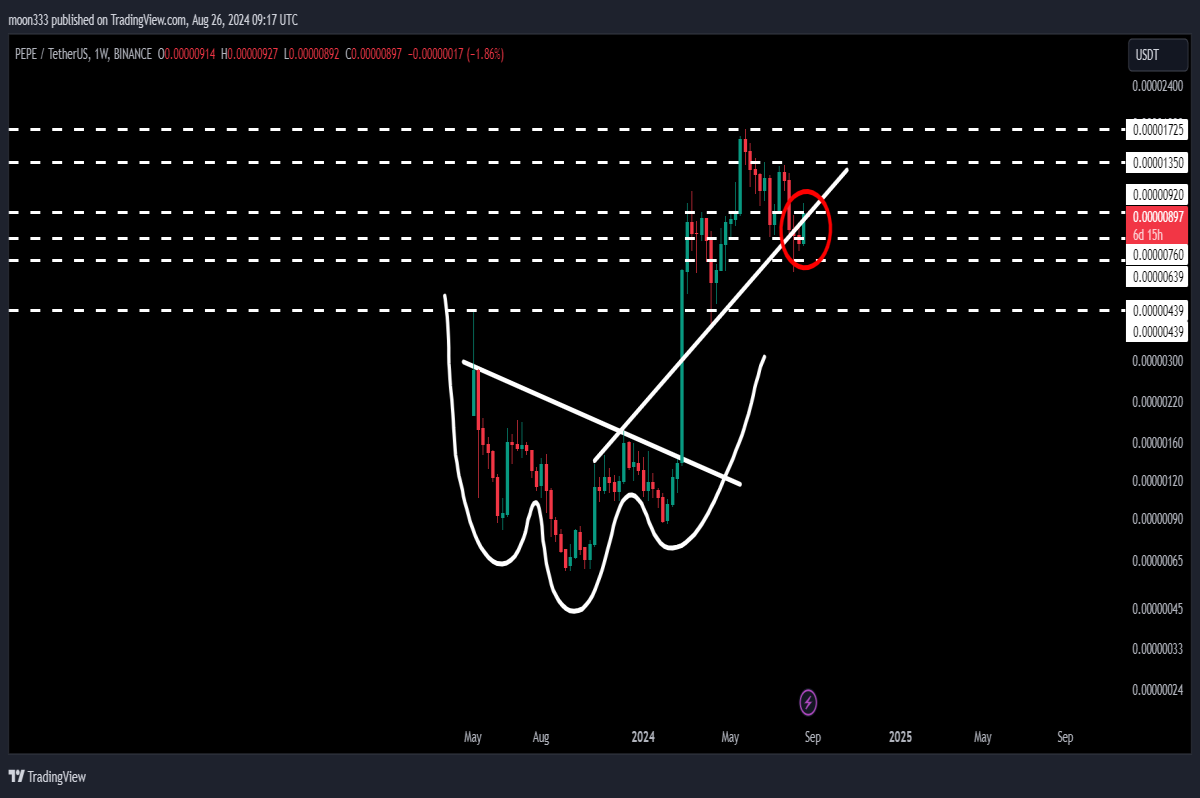
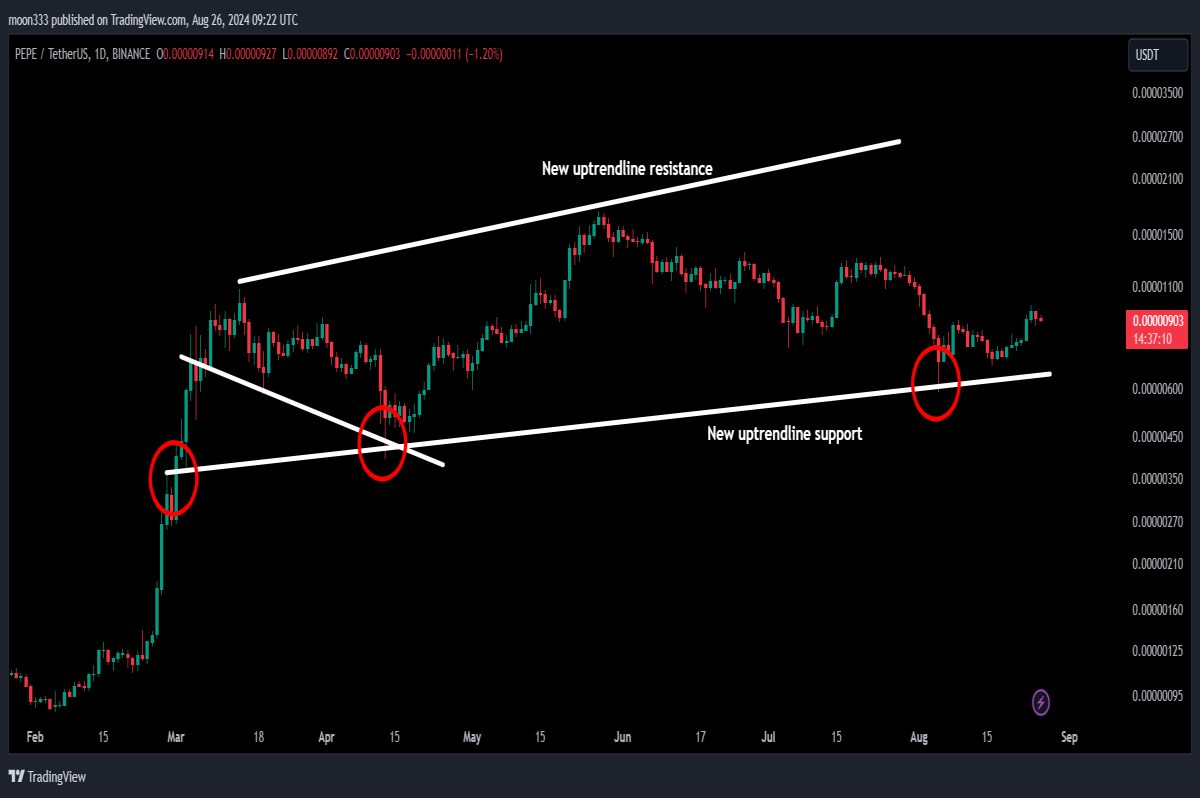
On the daily timeframe, PEPE recently experienced a breakdown of its uptrend line support. However, the price quickly recovered, moving back above this crucial support level. On the weekly timeframe, the inverse head and shoulders pattern, previously highlighted, led to a breakout above the uptrend line resistance. This resistance, after the breakout, flipped into support, providing a strong foundation for the price.
For detailed analysis, you can watch the below video:
Establishment of a New Uptrend Line Support
A new uptrend line support has emerged on the daily timeframe. By connecting recent rejection points and bounces, we can see that this support has been tested multiple times. It was initially a resistance level but has now flipped into support, further reinforcing the price's upward trajectory. This newly established support is critical to monitor in the coming days.
The Down Channel Breakout
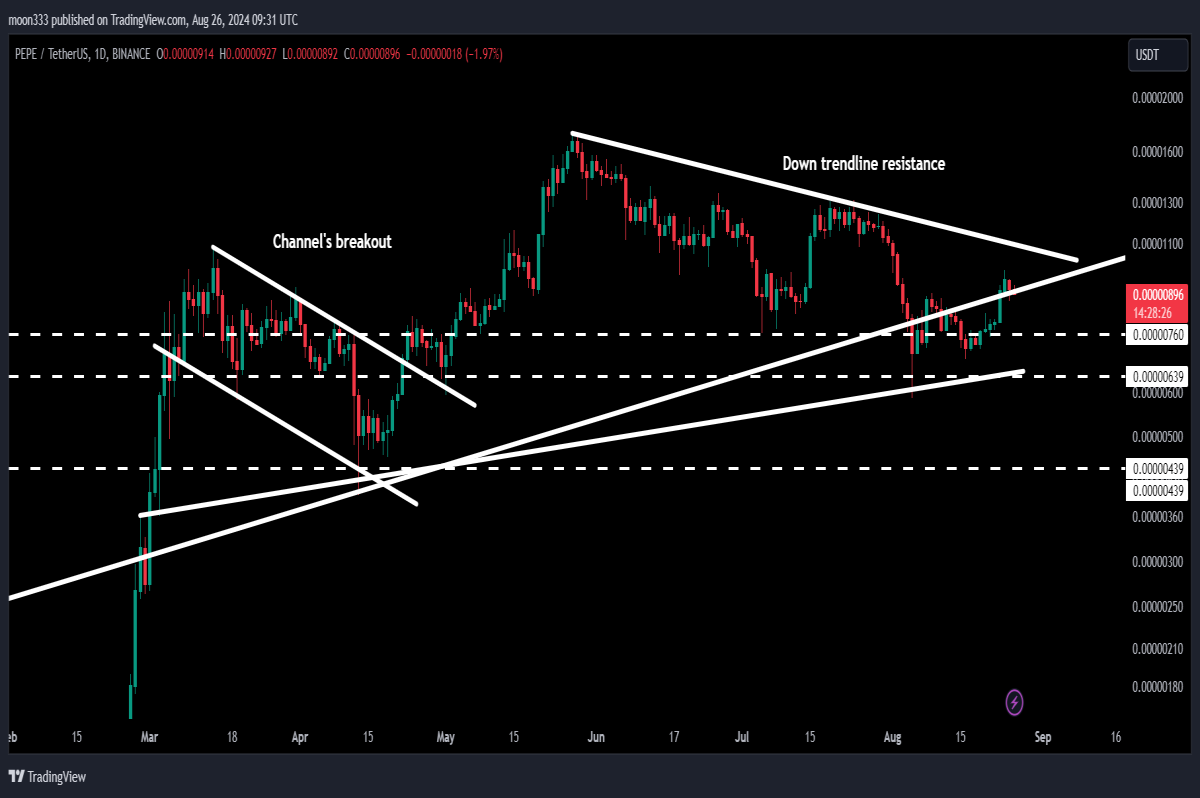
In previous videos, we discussed a down channel breakout, where the price was rejected by an uptrend line resistance. This resistance has been tested multiple times, with recent rejections indicating its significance. Additionally, a downtrend line resistance has been identified. If the price breaks this resistance, it is likely to test the uptrend line resistance again.
Recent Trade Signal: A Massive Reversal
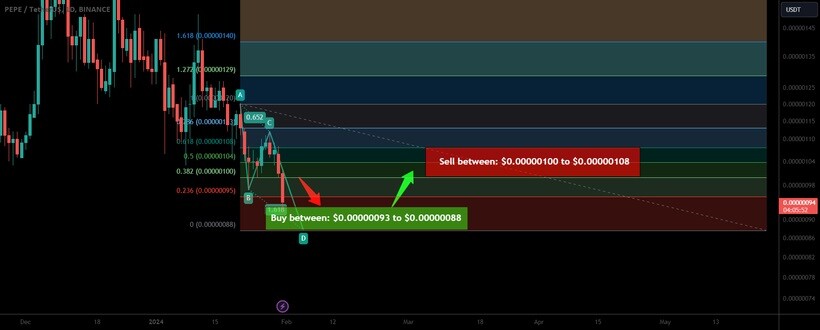
On May 1, 2024, a harmonic bullish "Alternate AB=CD" pattern was identified on the daily timeframe with the US Dollar pair. This pattern led to a massive rally, with the price surging by nearly 1900% from the buying zone. This trade signal, shared with members, highlights the potential for significant gains when these patterns are identified early.
Current Resistance and Support Levels
The daily timeframe shows that after breaking the uptrend line resistance, the price has retested and moved above the $0.00000920 level, which previously acted as support and resistance. A new uptrend line support has formed, and it is crucial to monitor this level, as it could provide a solid foundation for further upward movement.
Potential Breakout Target
If PEPE successfully breaks the downtrend line resistance, it could aim for the uptrend line resistance around the $0.000034 to $0.000035 level. This would be a significant move, suggesting that the price could test higher levels in the near future.
Conclusion
The recent developments in PEPE's price action indicate a potential for further upside, especially if key resistance levels are broken. As always, it's important to monitor these levels closely. For those interested in more trading signals, consider joining as a YouTube or Patreon member for daily updates and signals. Links to join are shared as below:


