
The Bitcoin price still has a lot of influence on altcoins . When Bitcoin shows a deeper retracement, you also see substantial retracements at alts. Since we are currently in a strong uptrend, with both alts and Bitcoin, the dips are good times to buy again. To see what the Bitcoin price can do in the coming days and weeks, we will take another look at the Bitcoin price today.
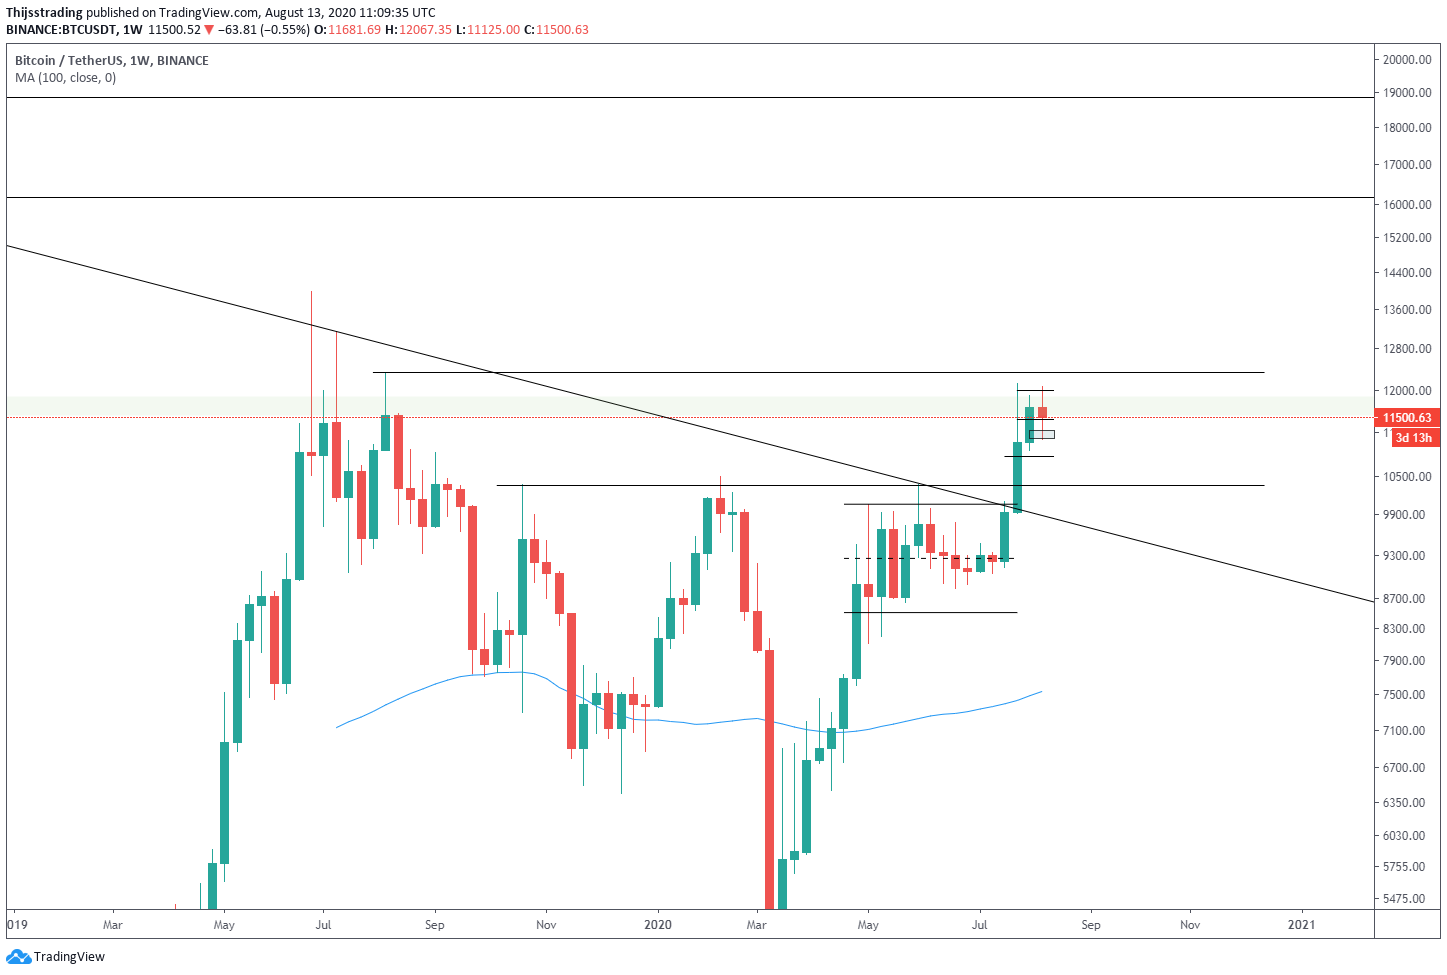
Weekly chart
Not much has changed on the weekly chart since our last update. We still have resistance from the $ 11,540- $ 11,885. This is an important level that we have to break to see continuation up. If we don't break that price area, we will likely see a temporary tilt, resulting in a deeper pullback. A possible bounce area could be between USD 10,141 and USD 10,510.
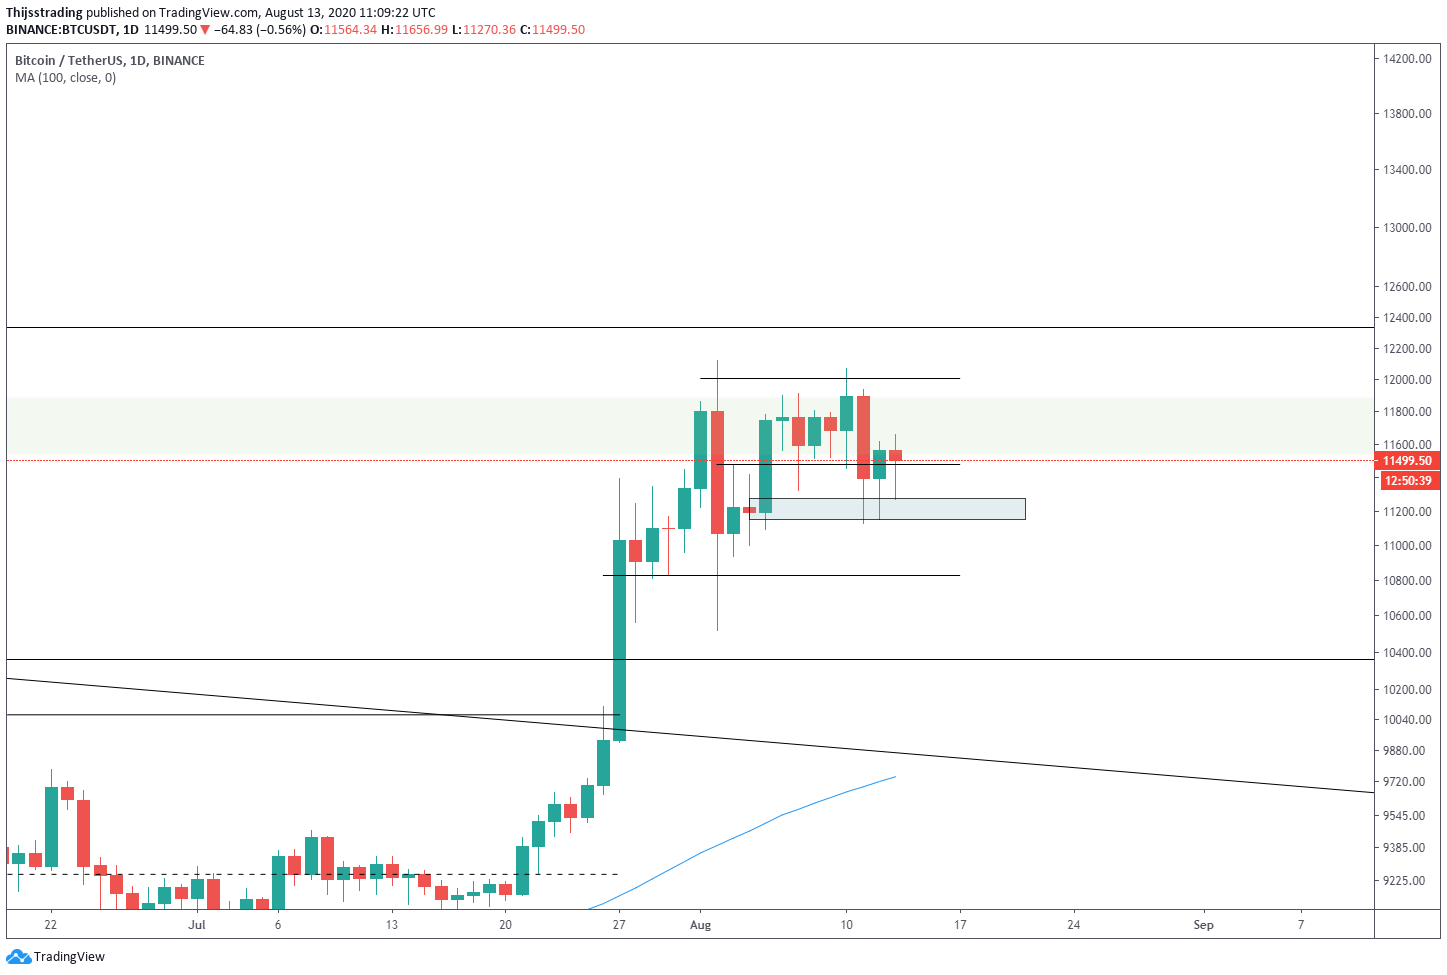
Daily chart
We are currently consolidating on the daily chart. We need to stay above USD 10,376 on the daily chart to remain bullish in the short term. If we manage to hold that level, we can go back to the resistance at $ 11,540- $ 11,885 and possibly break it.
4-hour chart
If we zoom in a bit further towards the 4-hour chart, it is clearly visible that we have formed a resistance around $ 12,000. This is the previous high, and the previous high will always provide resistance when the price returns to that area. Today we have seen a decline towards USD 11,270. From there we saw a nice bounce and now it's important to get a higher high. If we do, we confirm the $ 11,270 as a higher low and chances are we will continue up the road.
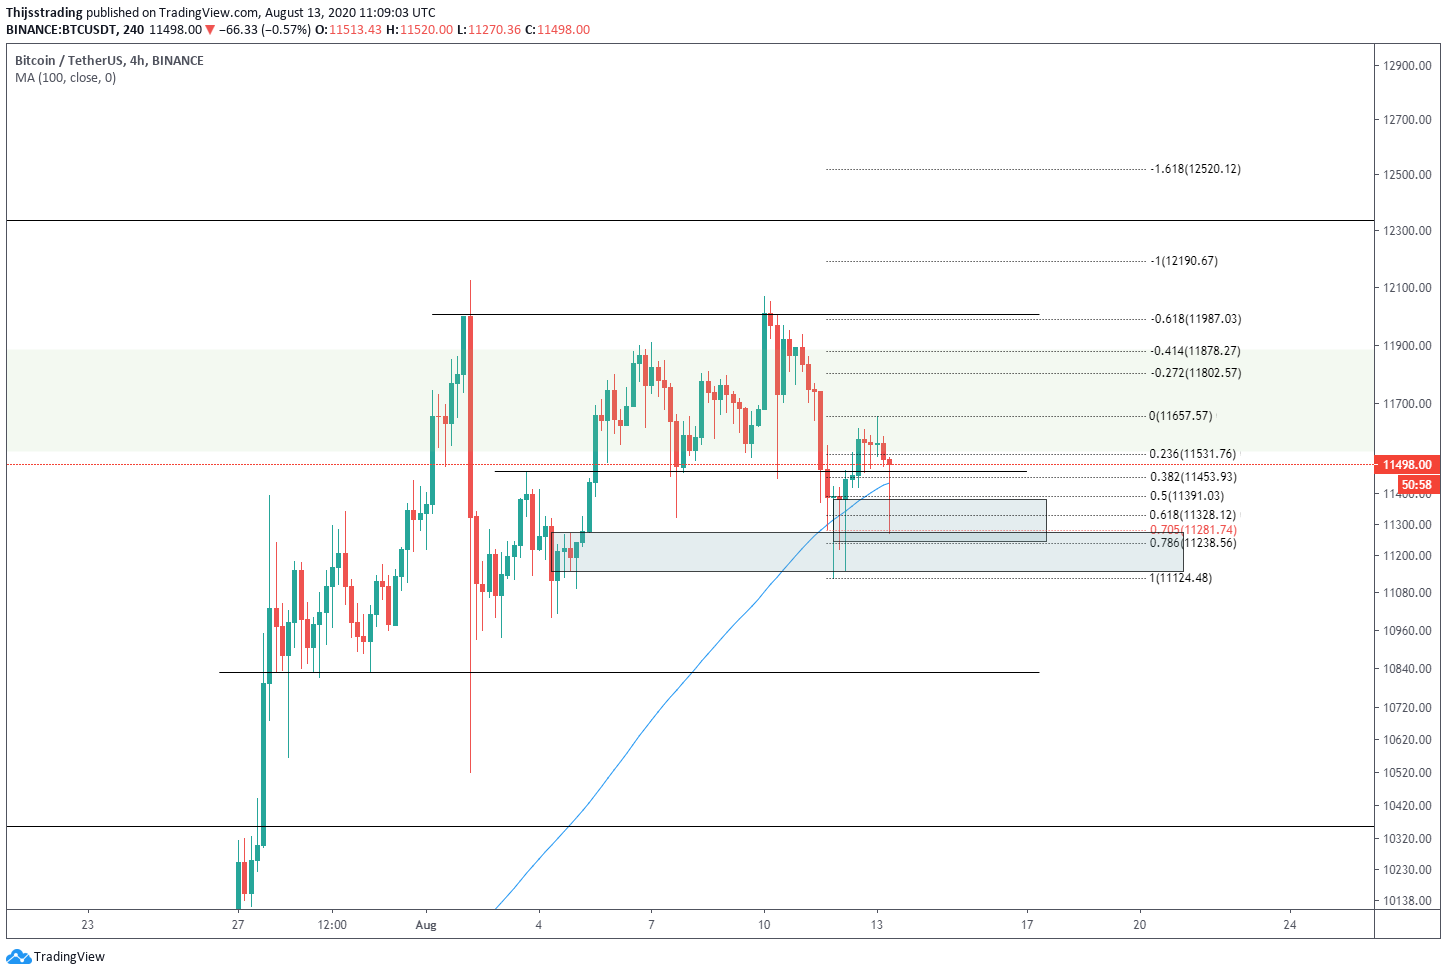
Conclusion
In short, breaking the $ 12,000 resistance means we are going to move further up. Furthermore, there is certainly still room to move down. A deeper correction towards $ 10,141 to $ 10,510 is certainly not out of the question, so keep that in mind. All in all, it just looks fine!


