Leading analyst Dmitry Gurkovsky talks about further possible scenarios for the movement of the price of bitcoin and several popular altcoins.
The cryptocurrency market continues to move up, with bitcoin and Ethereum being the growth leaders. For the leading asset, the first goal of the current rise is the area near the $10500 mark, from where the price can go into a correction to $6500 and again show strong growth within the framework of the reversal model. If the bulls manage to push the price above the $11500 level from the current levels, this will indicate the resumption of a strong upward trend and the beginning of working out a huge "Triangle" model, which can be observed on the weekly chart of bitcoin. Its breakdown will easily send the rate of the main cryptocurrency to past highs. In the current situation, Bitcoin Cash, EOS and Litecoin look quite weak, but as soon as the nearest resistance levels are broken, we can talk about extending the rise here.
Bitcoin
Bitcoin quotes on the weekly chart continue to move within the "Triangle" model. With the breakdown of the upper limit of this pattern and the price fixing above the $12000 level, there will be a potential for continued aggressive growth and development of the model. However, we should not exclude attempts to develop a downward correction with a test of the $6475 level. Near it, you can expect the completion of the formation of an inverted Head and shoulders model, which will provoke a strong rebound in the price up. The cancellation of the scenario with the continuation of the rise in this case may be a fall below the level of $3720, after which a breakdown of the lower border of the "Triangle" model is likely and the correction continues.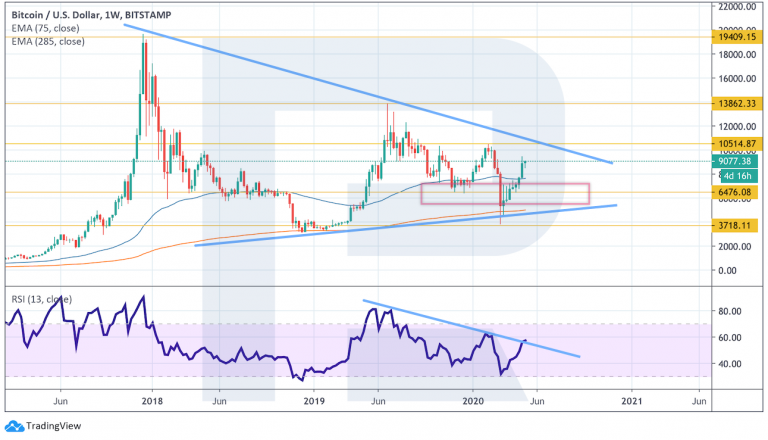
On the 4-hour chart, the quotes are once again" squeezed "within the"Triangle" model. For the main short-term trading idea, you can take the breakdown of this model up and continue to climb to the goal at $10515. This will be confirmed by the breakdown of the resistance area with a consolidation above the $9565 level. A strong signal in favor of this option is the rebound of the RSI indicator values from the uptrend line. The cancellation of the positive option will be a breakdown of the lower border of the "Triangle" model with the price fixing below the $8405 level, in which case we should expect a continued fall to the $7495 level.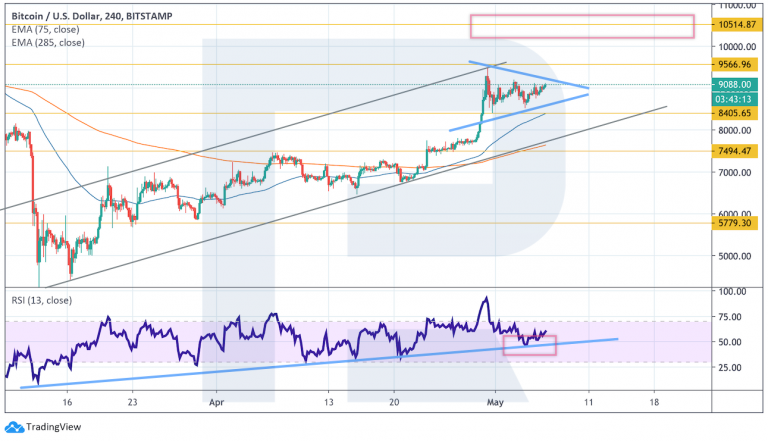
Ethereum
On the daily chart, the price of Ethereum continues to grow within the bullish momentum. Quotes continue to break through the upper limit of the Bollinger Bands indicator, which also indicates the dominance of buyers. The upper limit of the descending channel at the level of $260 may be the goal of the rise. An additional signal in favor of this option will be a rebound from the support line on the RSI indicator. The cancellation of the bullish option will be a breakdown of the lower border of the ascending channel with the price fixing below the $185 level, at which we should expect a further fall to the $147 level.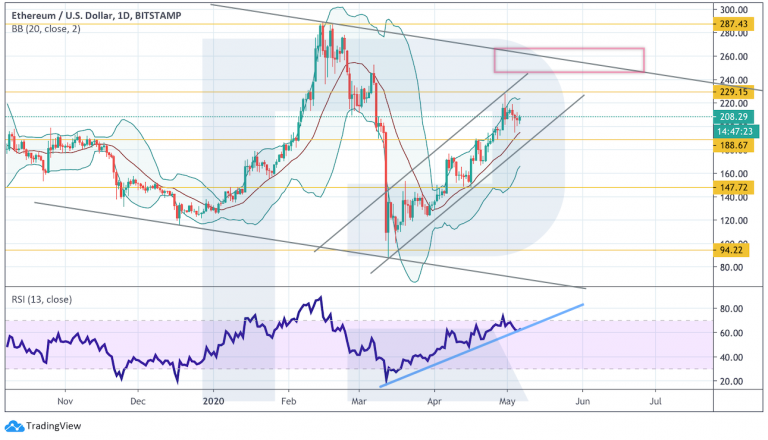
For small time periods, the asset value is adjusted within the ascending channel. We should not exclude a test of the lower border of the channel near the $195 level and a continuation of the price rise. The nearest target of this movement is the $230 level. A strong signal in favor of this option will be a rebound from the trend line on the RSI indicator. The cancellation of the scenario can be a breakdown of the lower border of the channel with the consolidation of quotes under the $190 level, in which case we should expect a further decline to the $175 level.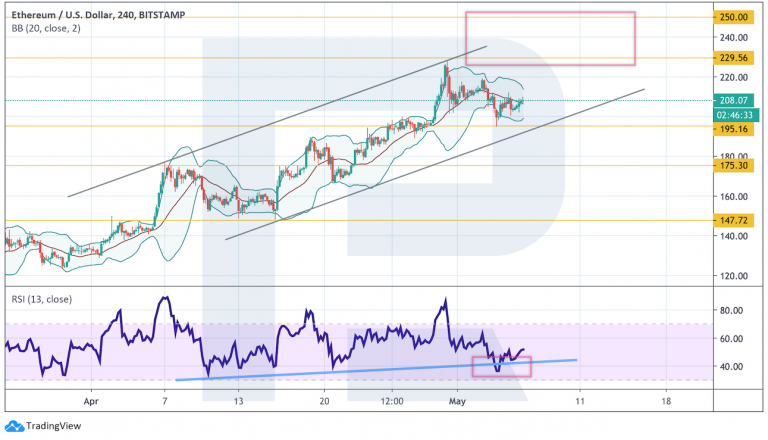
Litecoin
LTCUSD quotes are still testing an important resistance area. If buyers fail to gain a foothold above the $50 level, the downside risks will increase significantly. To continue climbing to the $65 and $82 levels, it is important to see a breakout of the specified level. The support line test on the RSI indicator is also in favor of the option with continued growth. The cancellation of the positive scenario will be a drop in quotes and consolidation under the $38 level, after which we should expect a decrease to the lower border of the channel near the $20 level.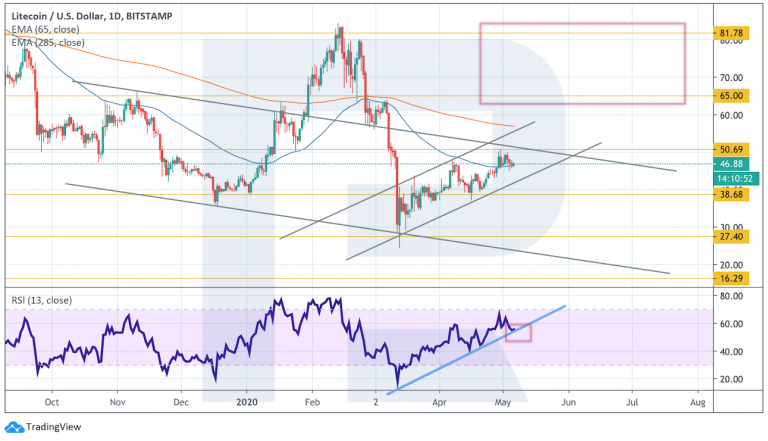
On the 4-hour chart, the price is adjusted within the ascending channel. There is still potential for continued growth to the levels of $50 and $54. a Strong signal in favor of this option will be another rebound from the trend line on the RSI indicator. Cancel the bullish scenario will perform breakout of the lower border of the consolidation of the rate under the level of $44, which is to move to a bearish option daily chart and expect price to drop to $20.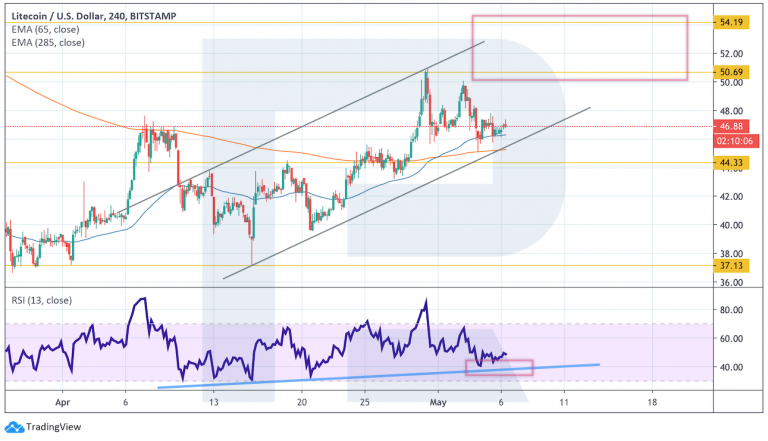
EOS
The EOS cryptocurrency continues to move inside the Ichimoku Kinko Hyo indicator Cloud. As long as the price does not break through the upper border of the Cloud and is not fixed above the $3.20 level, there are risks of a fall in the asset value. This option is supported by overcoming the ascending trend line on the RSI indicator. Confirmation of the bearish scenario will be a breakdown of the lower border of the indicator Cloud with quotes anchored below the $2.27 level, which will indicate that the price is out of the channel and the potential for a fall to the $1.28 level. To cancel this option, it is important to see a breakdown of the upper border of the Cloud, at which you can expect to continue climbing to the levels of $3.82 and $4.50.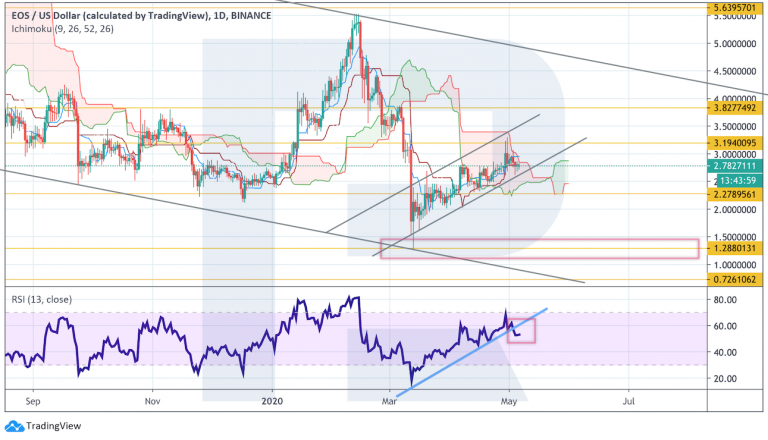
In smaller time intervals, the price is adjusted to the lower border of the ascending channel. We should expect a test of the $2.58 level and continued growth towards the goal at $3.20. an Additional signal here is a rebound from the support line on the RSI indicator. Cancellation positive for buyers will perform breakout of the lower border of the channel with the consolidation of the rate under the level of $2.55, which is to move to a bearish option daily chart and expect a strong fall in the value of EOS.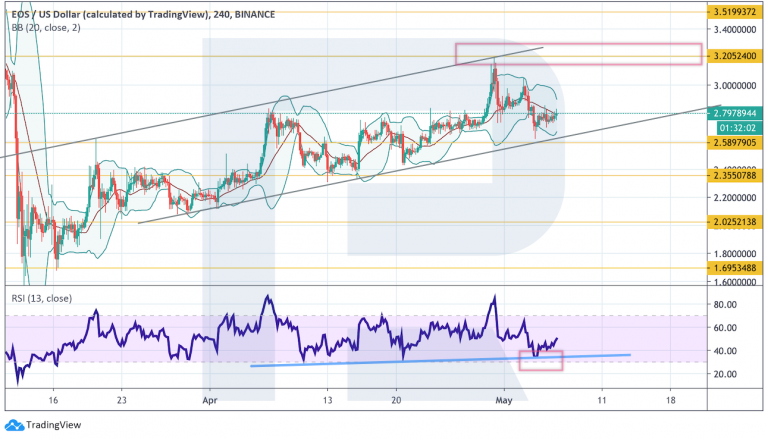
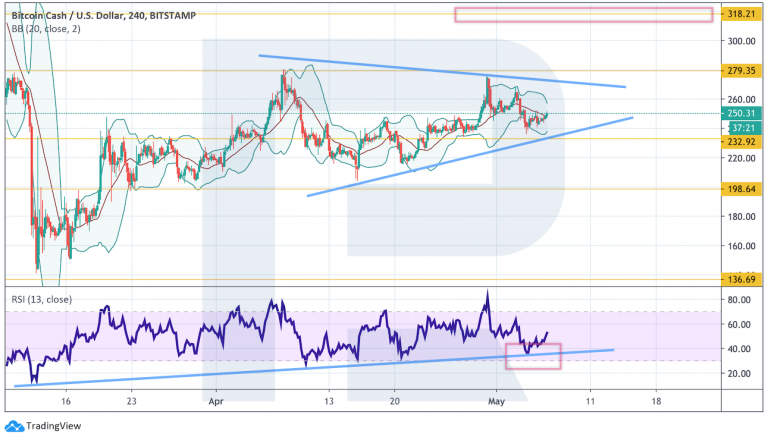
Bitcoin Cash
On the daily chart, Bitcoin Cash is testing the upper limit of the Bollinger Bands indicator for the second time, where we see a breakdown of the upper limit of the descending channel. There is potential for the price to continue rising to the $365 level. An additional signal in favor of this movement is a rebound from the support line on the RSI indicator. Confirmation of this idea will be the breakdown of the resistance area and the consolidation of quotes above the $285 level. The cancellation of the positive option for buyers may be a fall and consolidation of the price below the $202 level, after which we can expect a continued decline in the asset value to the levels of $135 and $85.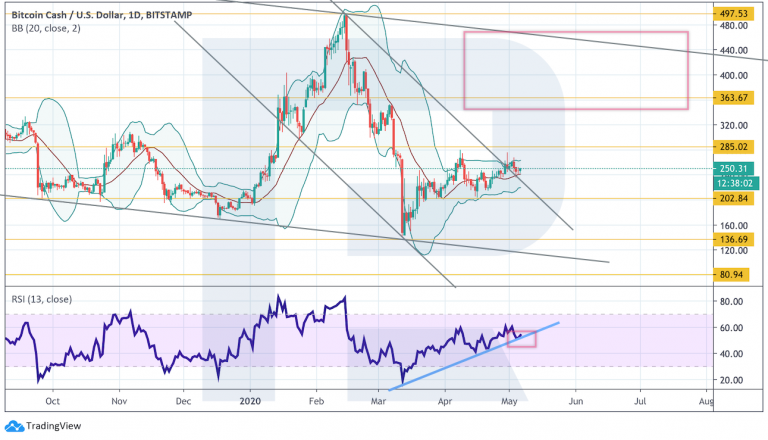
On the 4-hour chart, the cryptocurrency quotes could not go to work out the head and shoulders reversal model, and at the moment a "Triangle"is being formed. With the upper limit of the model breaking and the price fixing above the $280 level, we can expect a further rise with the goal at $318. A good signal in favor of such a movement is a rebound from the support line on the RSI indicator. As you can see, the last test of this line also provoked a strong growth in quotes. The cancellation of the option with the rise and development of the "Triangle" model will be a fall and a breakdown of the lower border of the pattern with the price fixing below the $220 level, which will indicate further movement to the first goal at the $136 level.