
Dear Readers,
SOLANA the most excited coin among every one with its strongest rally we have seen in the last year and the past couple of months.
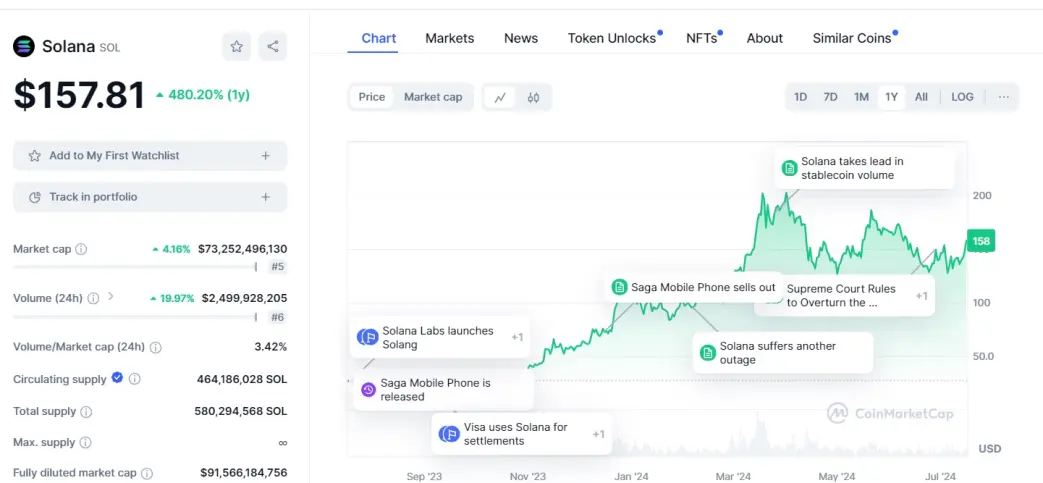
SOLANA is trading currently at $ 156.41, a up of over 3.5% in the last 24 hours. It currently ranked at No: 5.
With the market cap of $73,153,149,395 Solana has rallied 480.20 % in the past 1 year period.
We shall discuss the Elliott Wave Price Prediction & Technical Analysis of SOLANA with this article - but in simpler terms.
SOLANA broke above this trend line. We need to understand that the market reacted a couple of times to the micro support region but unsuccessful multiple times. The support did its job we had a first touch of the or actually with price dipped into this support region.
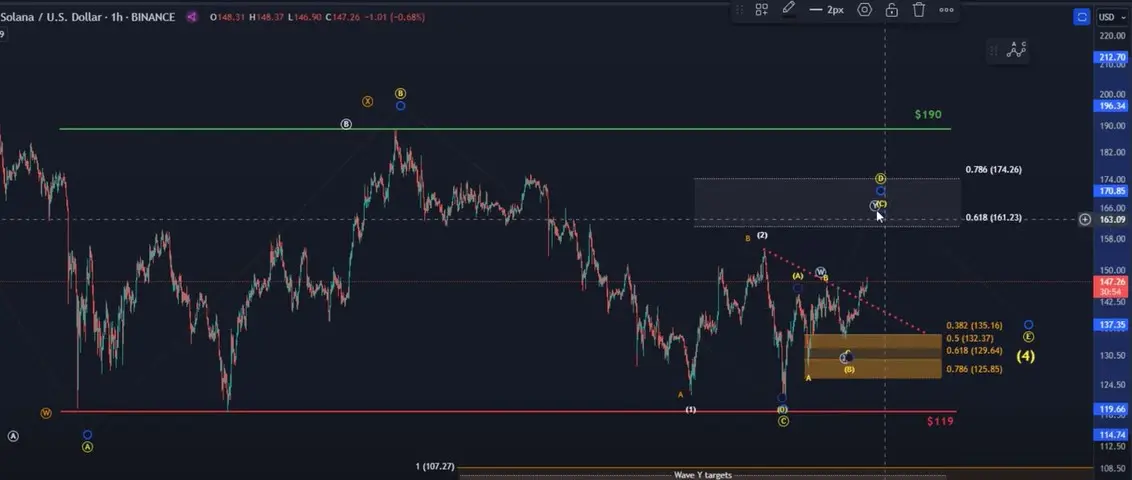
On Monday, the 8th July and this support region was defined it still is defined between $125. 81 and $135. 04 in that support region.
We could the see the price remains relevant for now I cannot rule out another test of the support region given the choppy price action that we've seen but for now. The trend is up and we are still dealing overall with this wave four triangle the overall bigger picture hasn't changed at all.
SOLANA is rather a little bit boring compared to some other coins at the moment at least in the short term. But we had a nicely defined support region and again. It was tested for the first time on Monday the 8th and then we rallied but I wasn't quite happy with how it looked just because it was not impulsive so we had another test of support but it formed a higher low. We then saw that break above the trend line a lot of coins are currently breaking above relevant trendlines.
All we need to double check but things are looking somewhat interesting obviously here on the SOLANA chart.
This is very consistent with previous updates we are tracking- I think a few months low. This is a triangle formed and the region between $161 and $174 roughly at the moment.
We could see there is a good reason to believe that if we get that D wave completed the e-wave might get back into the region around $ 135 to $140 roughly.
We could see the ABC structure in Wave Y well what is that you know what can we do with that with this. We can add another micro support region. The support area can be fixed at $137. 25 and $142.4 here. The a, b and then a c-wave rally from there to the upside may form from here.
The breaking of $ 144.61 that is when you know there could be a first indication that the SOLANA price is starting the decline in the small B wave.
But it would most likely just it would be a b-wave corrective pullback ideally re-testing the trend line from above and then may be continuing with wave further.
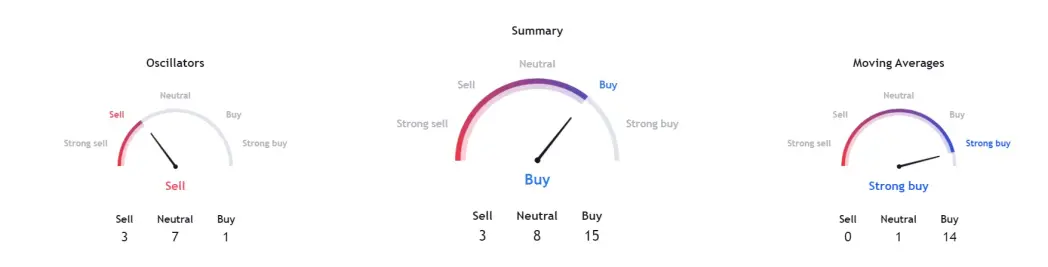
If you also see the technicals, the indictors are also good for Solana.
So have a watch on Solana encounter friends!
=
Are you looking for a regular passive income?
Here is an excellent opportunity for you with tangled.com
tangled.com is the fastest growing social site where you can earn in handsome and automatically monetise all your contents- just like plug and play. Just explore and join with my referral: https://hiraj.tangled.com/join and enjoy earning Millix in a very simple way and cash out to your cyrpto wallets with a minimum threshold of $1 with a simple click!
On you sign up, you need to create 2 wallets ( primarily and for reactions) with the millix eco system to receive all your income generated incomes which is a simple easy process.
I guarantee you all that this platform gives you super earning!






