
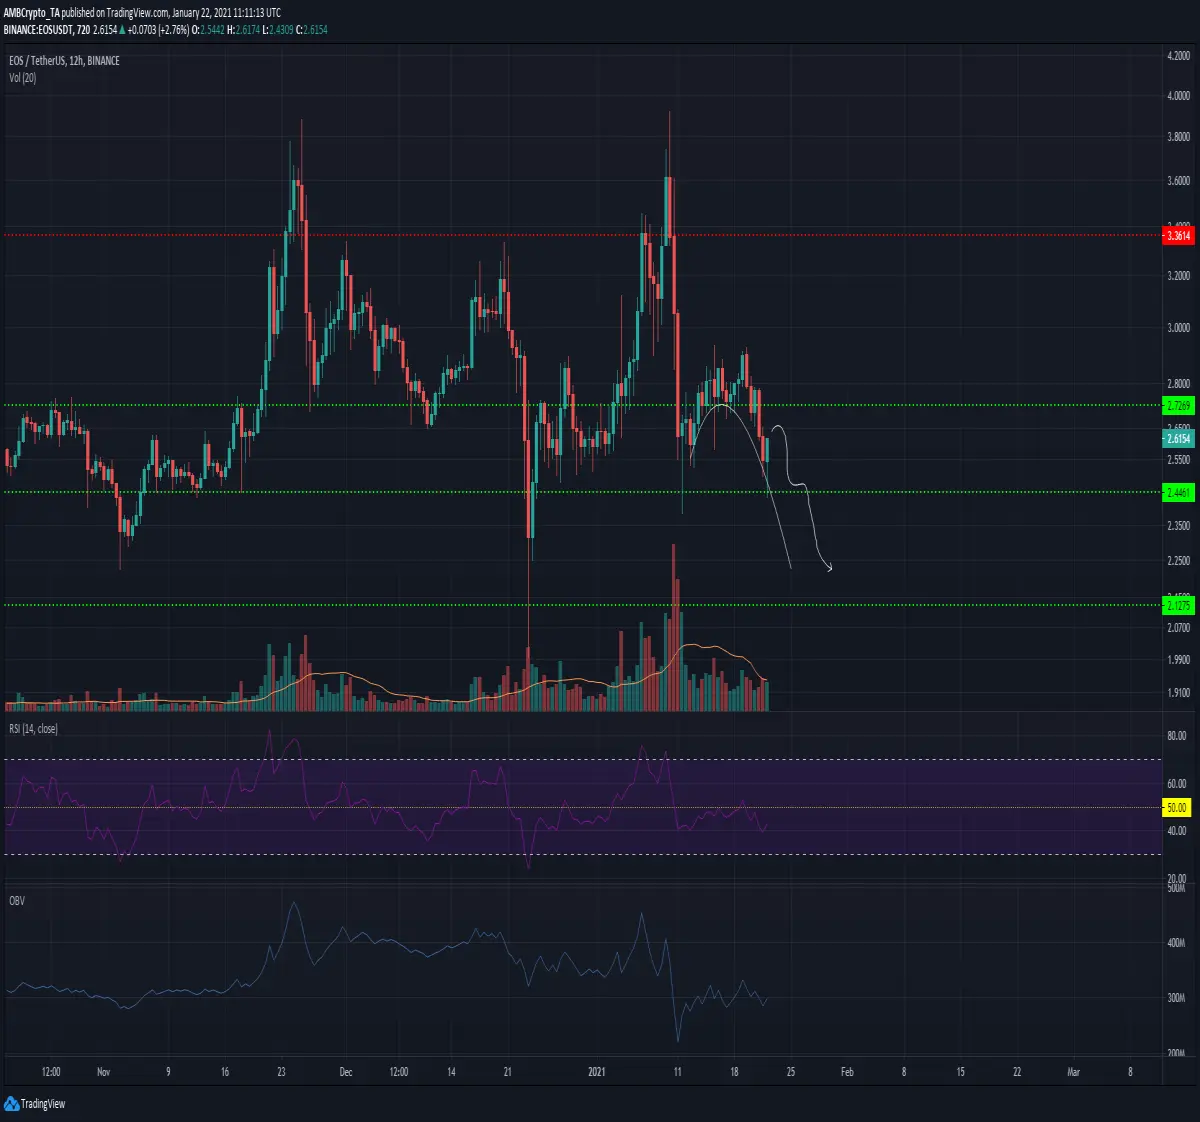
In the past two months, EOS has faced stiff resistance from the $ 3.6 zone. The $ 2.7 and $ 2.4 support levels were tested multiple times. Aside from EOS's volatility, the larger picture seemed to show a double-topped formation at $ 3.6. Unless the price consolidates at $ 2.4 in the coming days, chances of recovery will be slim for EOS. There are probably more drawbacks to as low as $ 2.1.
EOS 12-hour chart
Source: EOS / USDT on TradingView
As stated earlier, the $ 3.6 level turned down the bulls' attempts to push the price higher on the charts. The $ 2.5-2.7 zone has been significant in the past two months, and EOS has once again found itself in this zone, avoiding selling pressure at the time of press.
The $ 2.7 level could be retested as resistance in the coming days. OBV showed that it saw enormous sales volume in the second week of January as the price dropped from its high of $ 3.6. Since then, the purchase volume has slowed down, while it has been roughly equal over the past few days.
However, this can be set to change. The price has been seen to form an inverted and descending comb pattern and this pattern is highlighted by the smooth white curve representing where the EOS will go if confirmed.
The RSI once again dropped below 50 after testing it as resistance, showing that the downtrend is continuing. The most recent trading session saw the price visit $ 2.44 and quickly rise to $ 2.61.
The accompanying tables highlight a path for EOS in the event of a white, inverted comb pattern appearing. A drop to $ 2.5 can be expected, and some possible side trades can be expected before falling to $ 2.3. A move below $ 2.55 confirms the pattern and a short position can be entered with a target of $ 2.3.
Invalidating this path would be the EOS move above $ 2.72.
Result
A possible comb pattern also emerged, which can see the EOS drop to $ 2.3. While the override of this pattern would be a trading session above $ 2.7, the confirmation of this pattern would be a closing trading session below $ 2.55.






