
Bitcoin hit a 21-month low amid stock market volatility and the highest PCE inflation in the US in 3 years, triggering liquidations of around $600 million per hour in the crypto market.
Cryptocurrency liquidations surpass $600 million in one hour as BTC price falls.
TradingView data showed BTC/USD falling to $58,035 on Bitstamp — a level it last traded at in September 2024.
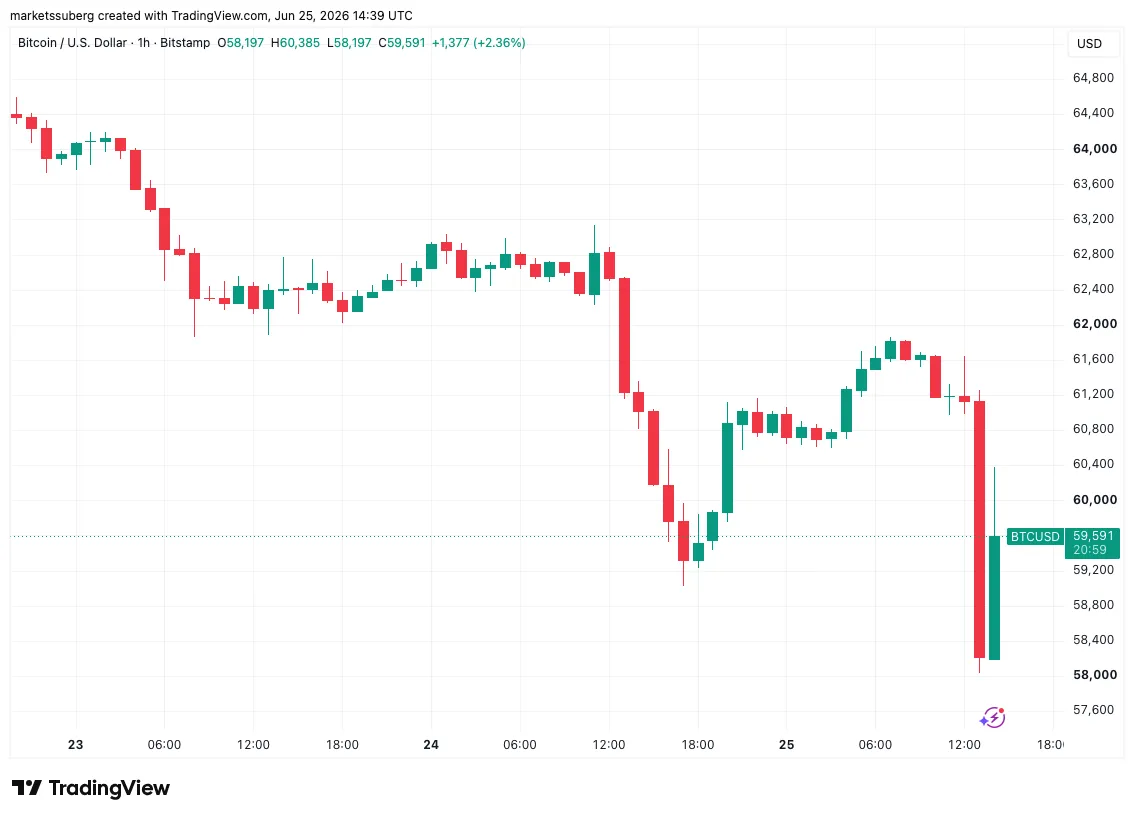
One-hour chart of BTC/USD. Source: Cointelegraph/ TradingView
The U.S. Personal Consumption Expenditures (PCE) index, released in May, rose 4.1%, setting a new three-year record.
"Compared to the previous month, the PCE price index for May increased by 0.4%. Excluding food and energy, the PCE price index increased by 0.3%," stated a press release from the Bureau of Economic Analysis (BEA).
“Compared to the same month of the previous year, the PCE price index for May increased by 4.1%. Excluding food and energy, the PCE price index increased by 3.4% year-on-year.”
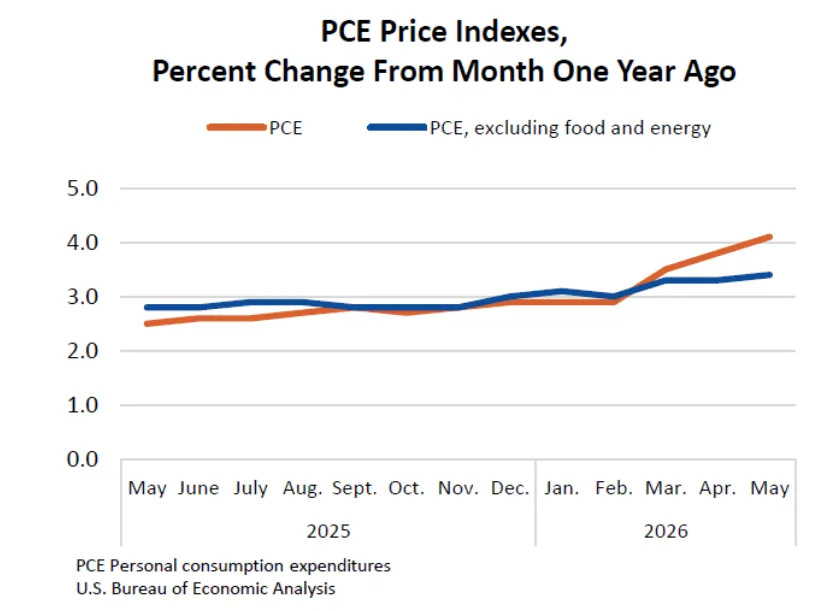
Monthly percentage change in the US PCE (Personal Consumption Price Index) (screenshot). Source: BEA (Bureau of Economic Analysis).
Stocks reacted with volatility, with the Nasdaq Composite index falling 0.5% at the time of writing, while the S&P 500 managed to register a small gain.
Meanwhile, the Nasdaq 100 registered an even larger, sudden drop of 2% in just 30 minutes at the opening.
"What a chart!", commented the investment website The Kobeissi Letter on X.
Bitcoin itself triggered substantial liquidations of long positions, with CoinGlass estimating total liquidations across cryptocurrencies at $600 million in just one hour.
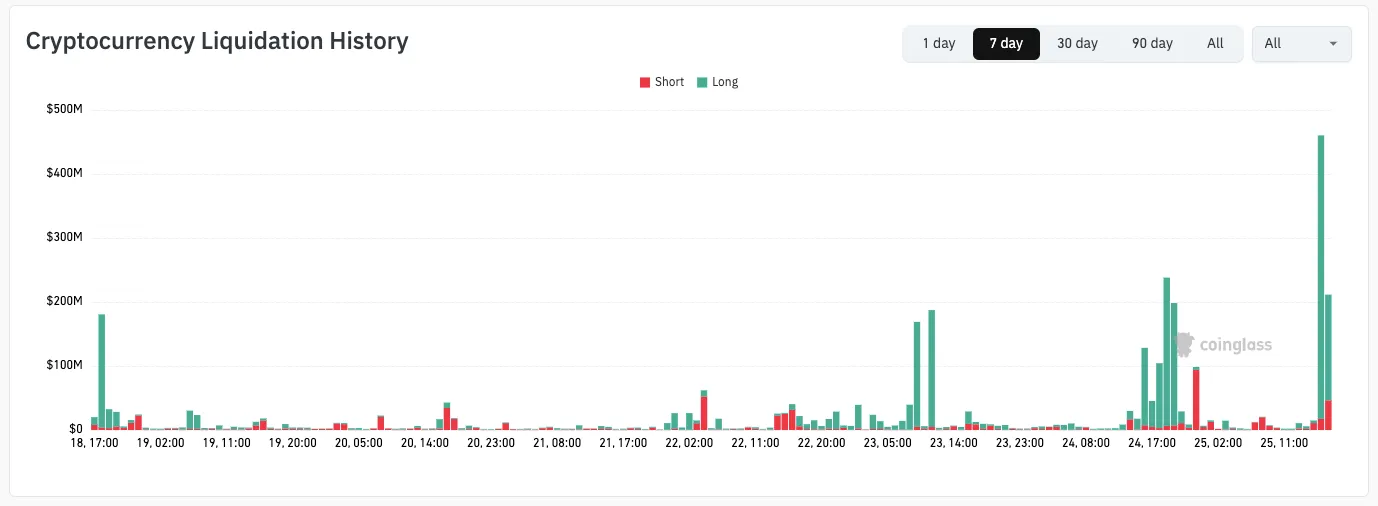
Cryptocurrency settlement history (screenshot). Source: CoinGlass
In the comments, market participants suggested that price fluctuations were being artificially manipulated to squeeze positions.
"Bitcoin is being manipulated," the pseudonymous trader Killa told X's followers.
"Every time $BTC trades below $60,000, it indicates our manipulation below the significant low of $60,000 on the weekly and quarterly charts. That's exactly why the order book is so far below us."
Source: Killa/X
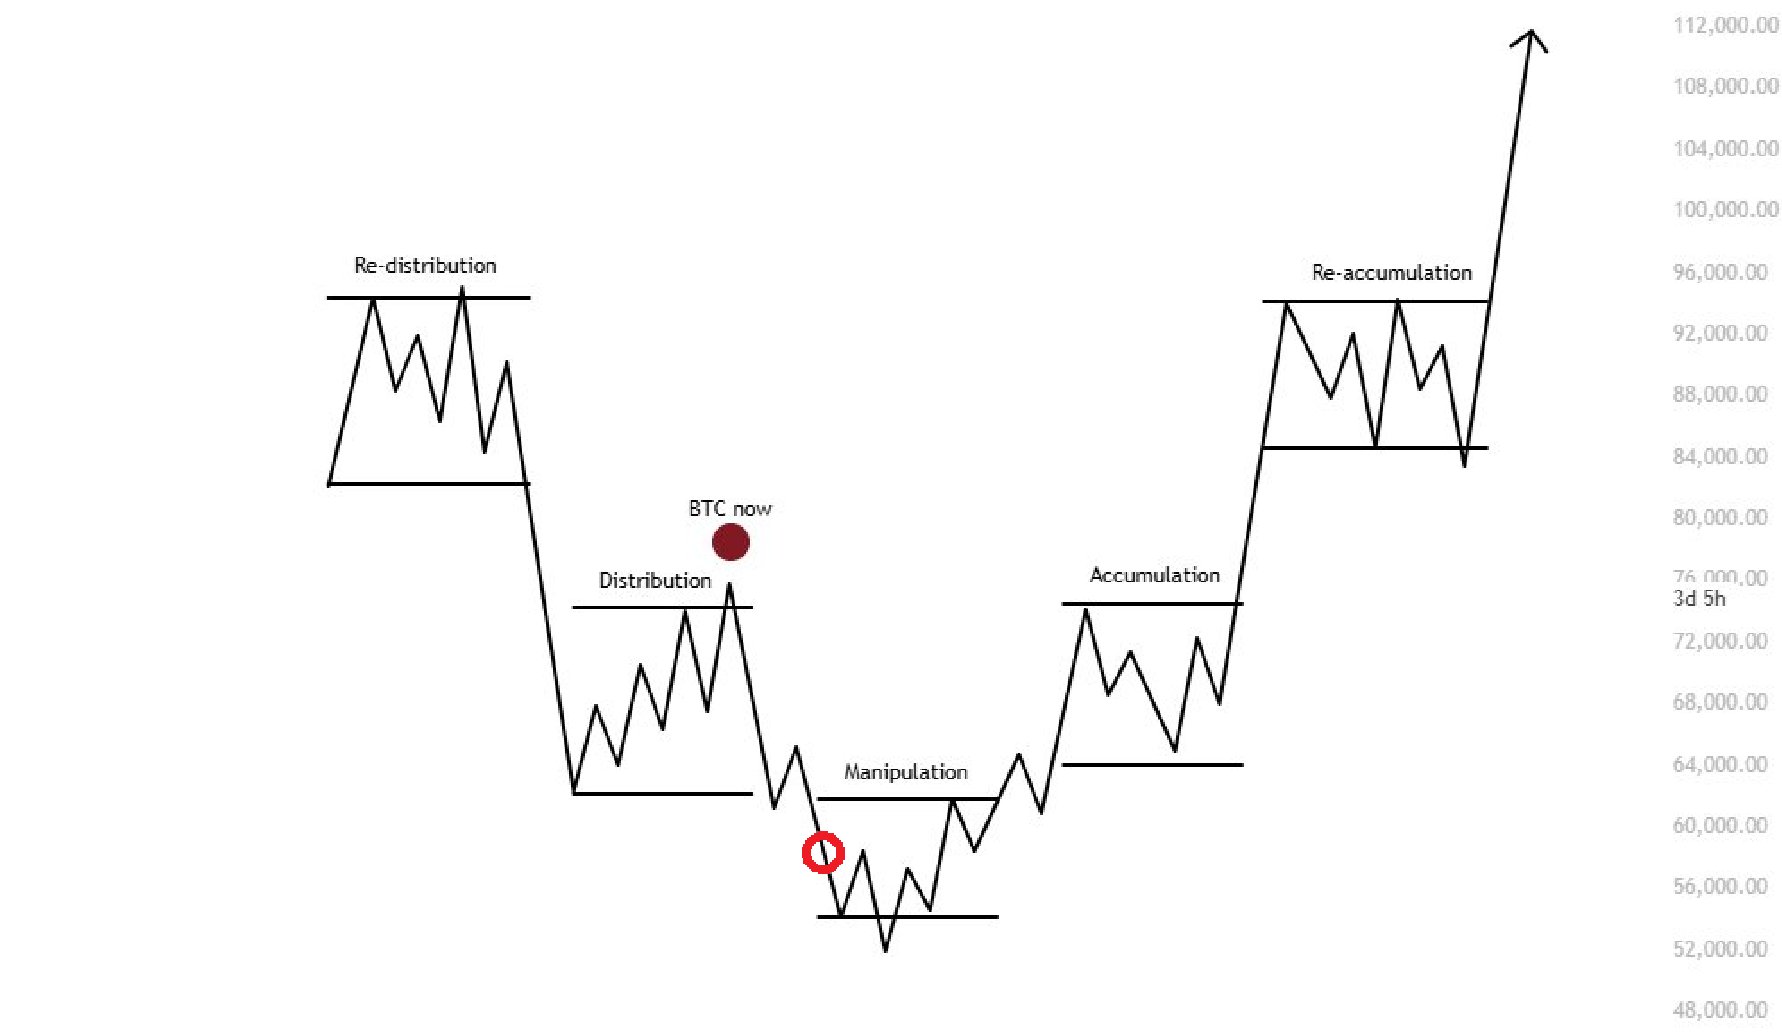
Niels Klaver, co-founder of the cryptocurrency platform STABL Agency, suggested that BTC/USD "appears to be heading for its final dip in this bear market."
"The target remains $55,000," he added, referring to a short-term price target that is becoming increasingly popular.
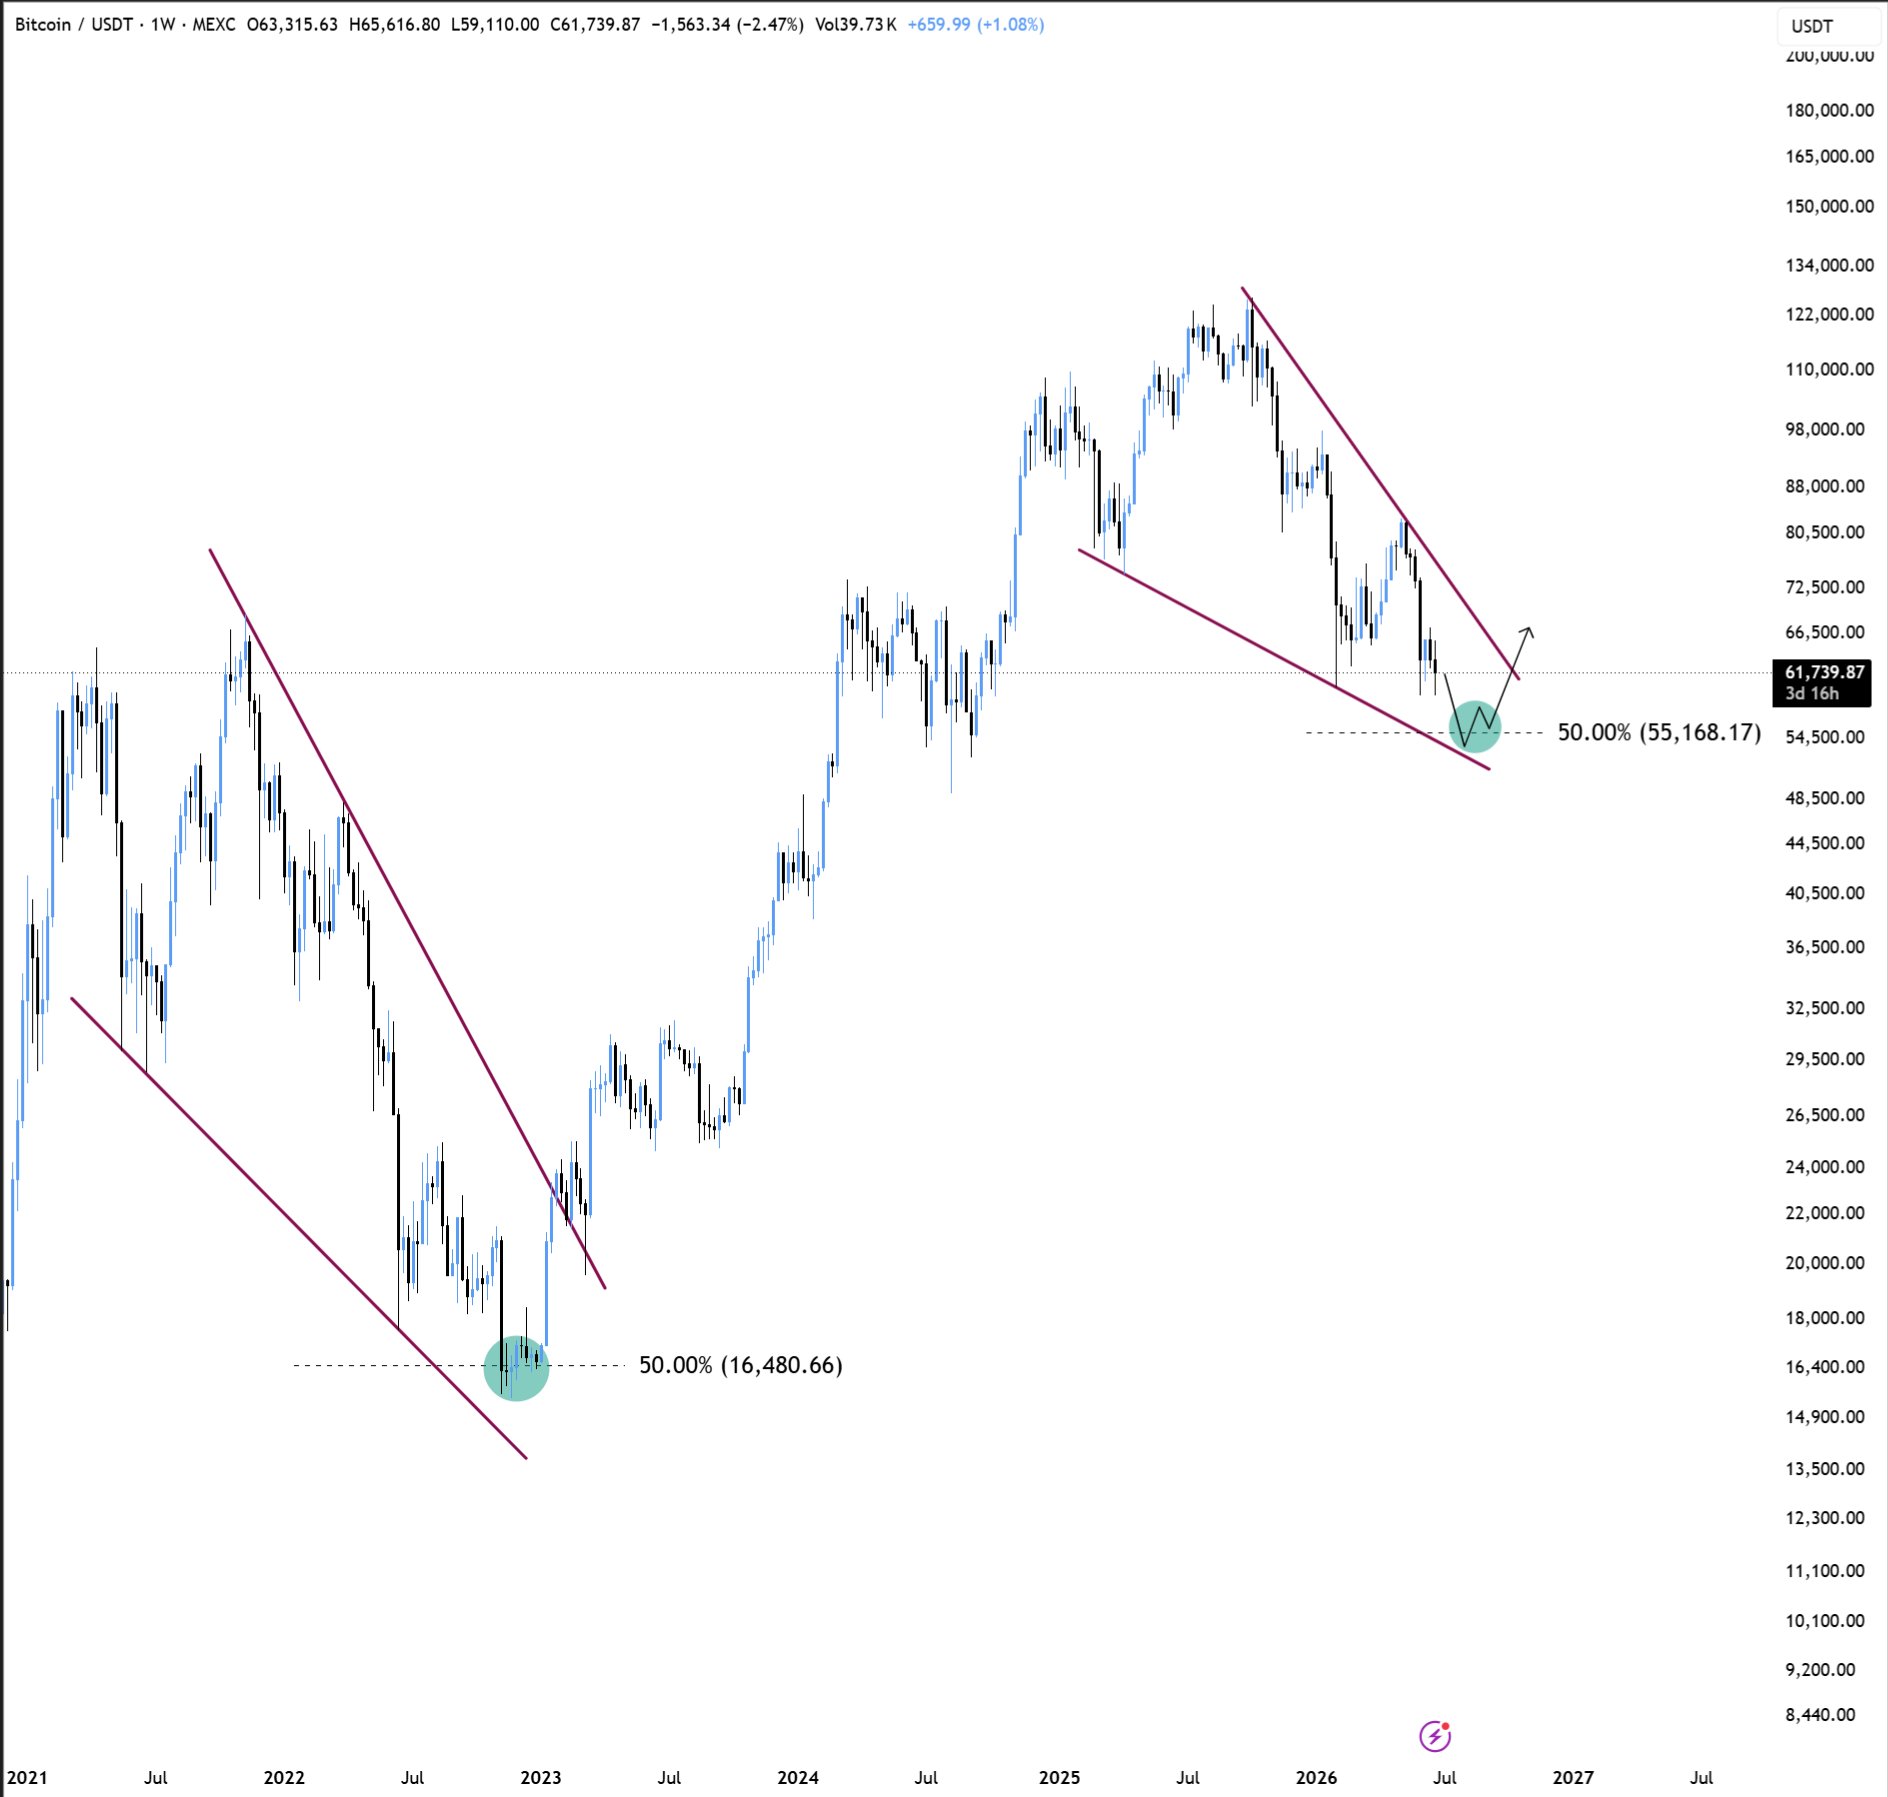
One-week BTC/USDT chart. Source: Niels Klaver/X
Bitcoin analysis points to new resistance near $65,000
While the price of BTC was attempting a modest recovery, the trading and analytics firm Rekt Capital had already described the $60,000 support level as "clearly weakened."
"Once the monthly closing figures for June are released, we will know from what price July could potentially begin a recovery after the fall," said a publication from X.
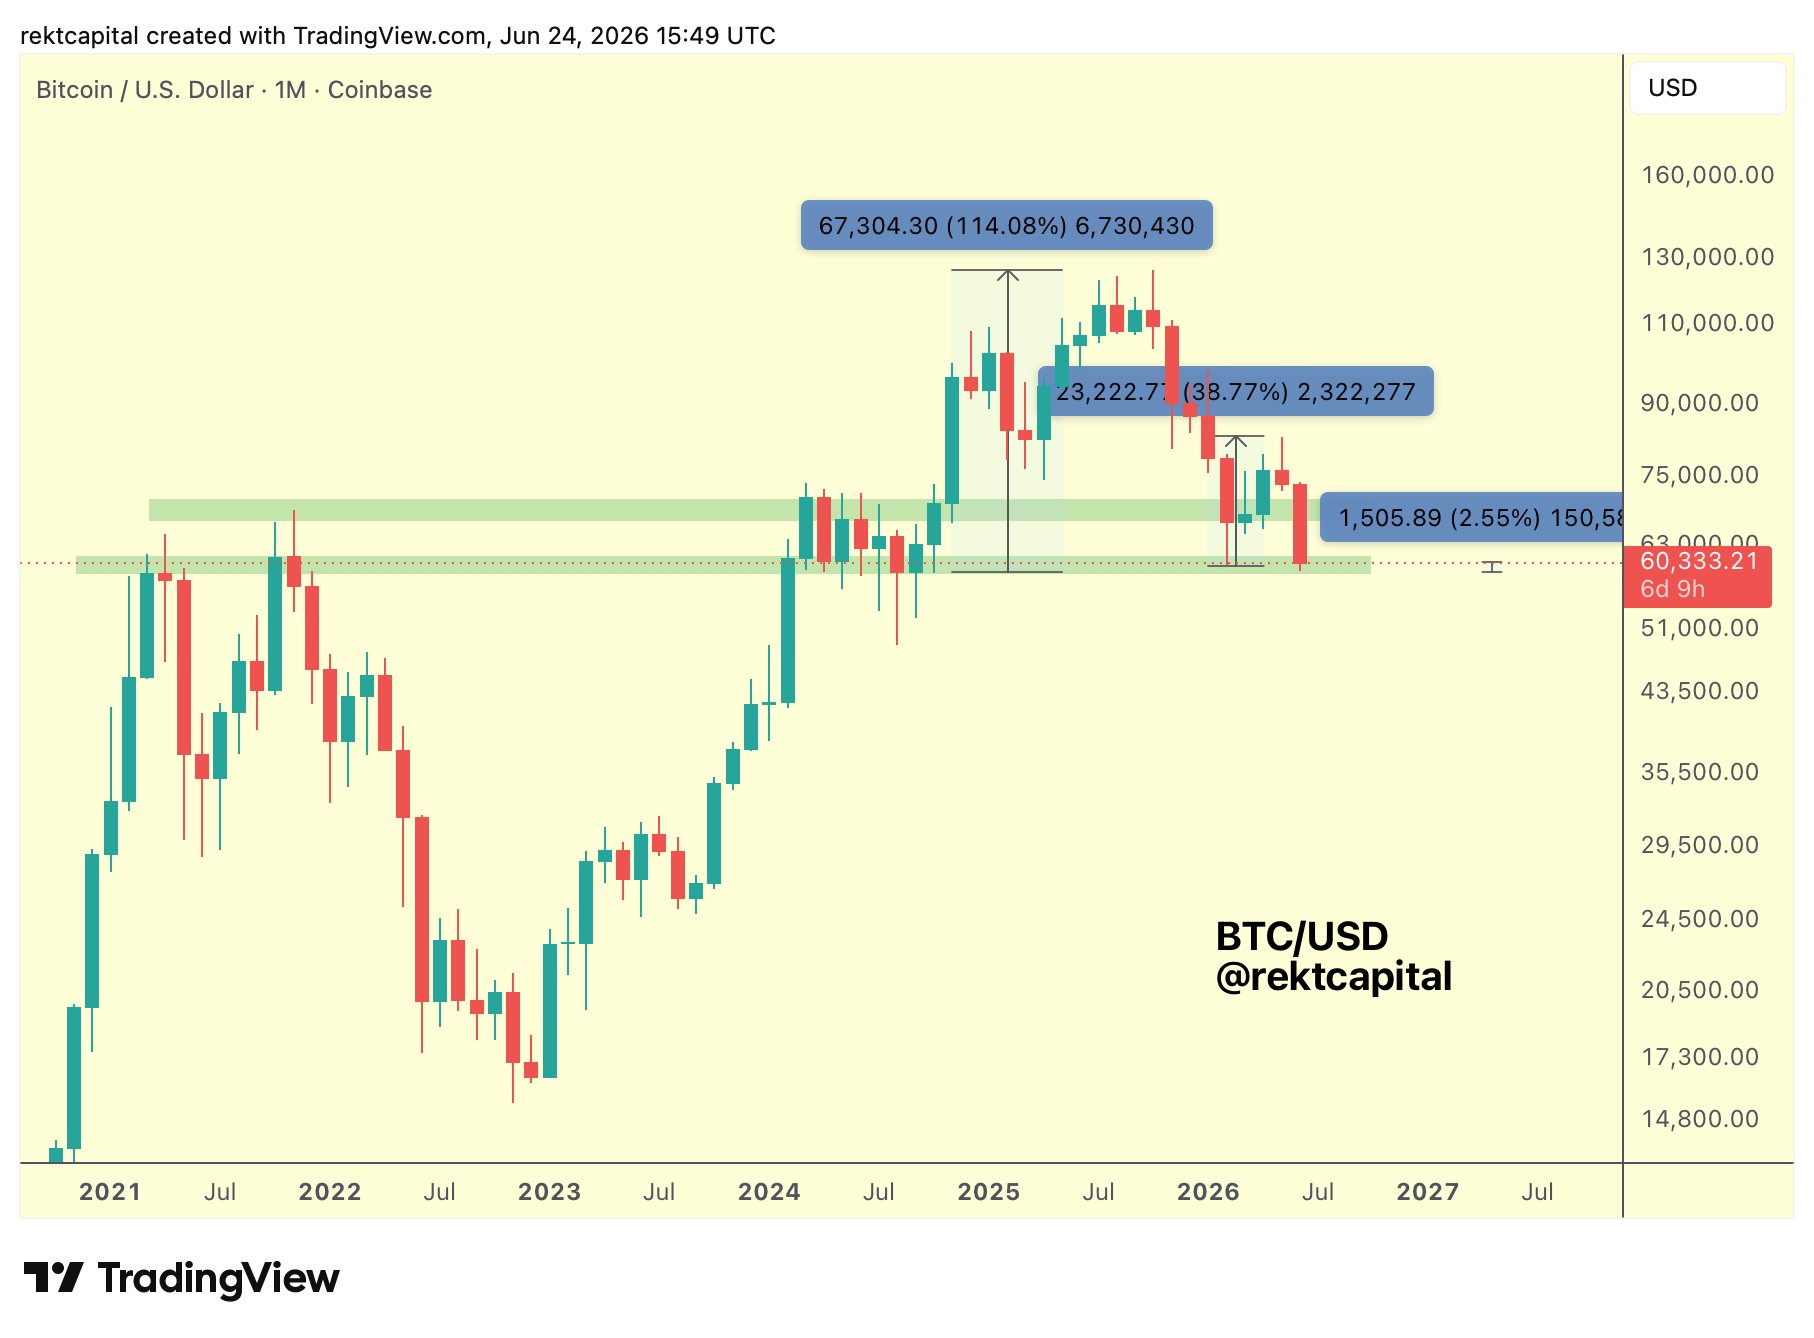
Monthly chart of BTC/USD. Source: Rekt Capital/X
Rekt Capital stated that the market was behaving similarly to 2022, with the 50-month exponential moving average (EMA) predicted to become the next resistance.
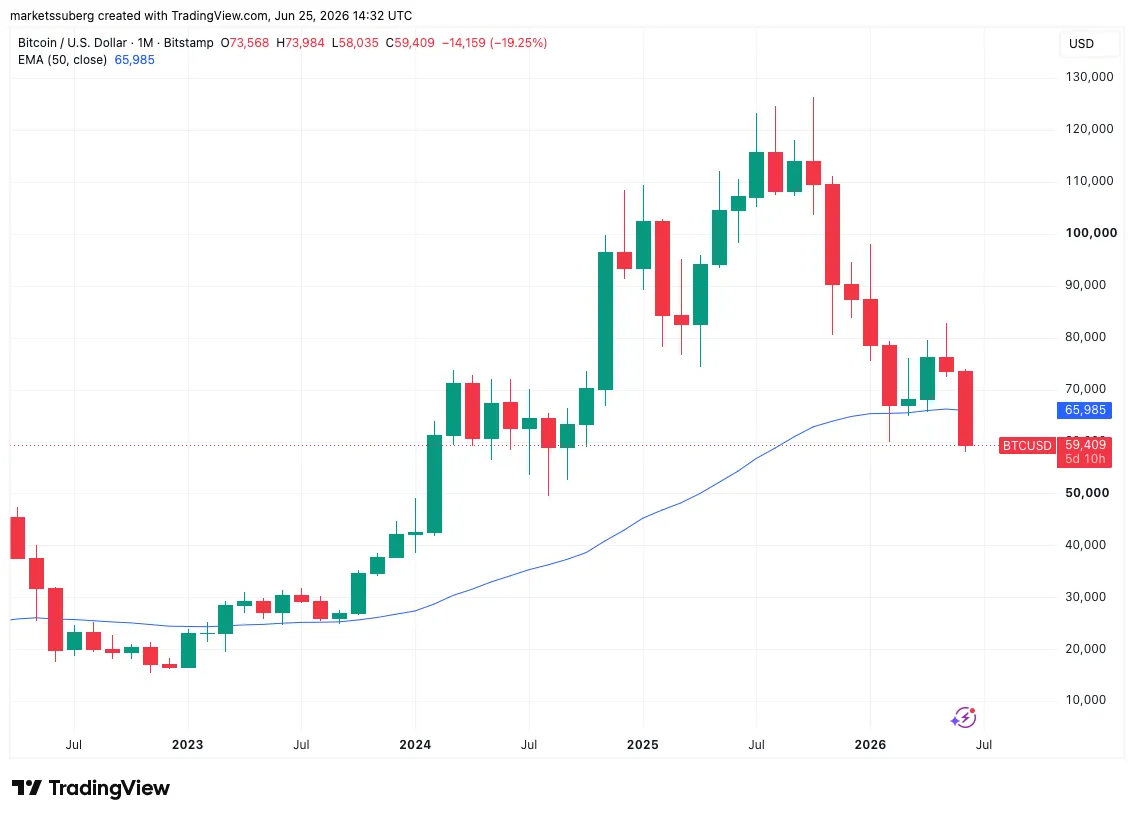
One-month chart of BTC/USD with a 50-period EMA. Source: Cointelegraph/TradingView