
I am not sponsored by anyone or anything mentioned in this article.
This is not financial advice. I am not a financial advisor.
Please do your own research before making any decisions before investing.
This article is meant for educational purposes only.
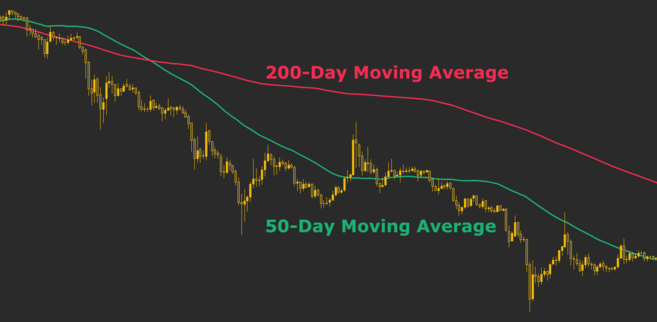
With the way the market is trending at the time of writing this article, many individuals are worried about a possible death cross pattern on the trading chart. A death cross pattern is a technical indicator that occurs when an asset's short-term moving average falls below the long-term moving average. This is usually the 50-day (short-term) moving average crossing below the 200-day (long-term) average. It's believed amongst investors and market analysists that moving averages define a trend and provide support and resistance. It also gives trading signals when moving through each other, called moving average crossovers.
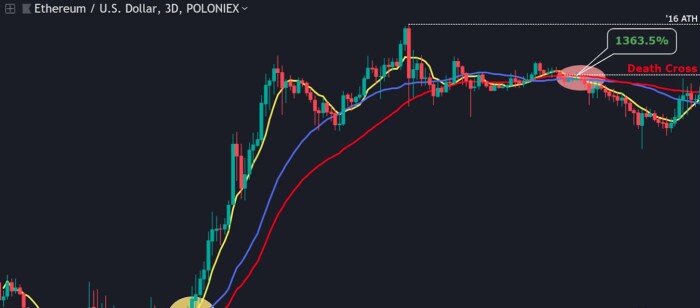
A crossover signal is generated when a short moving average crosses over a long-term one or vice versa. The death cross is a highly bearish sign signifying a current downtrend will remain in the same direction for a long period of time. For experienced traders, when this short-term moving average crosses below the long-term average, it's generally a signal to sell their stake. Check out the old trading chart for Ethereum down below. Do you remember when ETH was only $1,363?
Given that the crypto market is highly volatile, it's always difficult to follow the trend patterns and flow of the market overall. Luckily, we can utilize trade pattern tools to help out slightly, but be cautious as they are never 100% concrete proof that an asset will increase or decrease in value. Despite the apparent predictive power in forecasting prior bear markets, death crosses also regularly produce false signals. A death cross should be confirmed by other signals and indicators before rushing to sell off any current assets.
Certain aspects of technical analysis can be seen as controversial because of volatility. Some investors rely on trading signals for all of their trading, while others sit back and make their own analysis apart from the traditional methods. When reading charts accurately and taking experienced educated guesses, that's when the investor has the potential to make a lot of money... or lose a lot! Never forget that if investing and trading were easy, everyone would be doing it for themselves!
What technical analysis do you use when trading?
Let us know in the comments down below!
Thanks so much for reading!
Please feel free to follow my page for daily blog posts about crypto news, updates, and research!
Have a wonderful day!


