Please see the content of our news for the current Chainlink technical analysis for Link, one of the most popular altcoins of the crypto money markets, Link / USD parity and Chainlink price chart.
Chainlink technical analysis of 22.04.2020
Chainlink is one of the top 10 strongest candidates in the cryptocurrency markets and is listed as 11th in the CoinMarketCap right after Tezos at the time of writing.
Chainlink and other crypto prices, especially Bitcoin,
On March 13, after the World Health Organization declared the Corona Outbreak a global pandemic, it literally crashed. Bitcoin fell below $ 3,900, while Chainlink saw $ 1.5.
At the time of writing, we see that Chainlink completely got rid of the impact of the crisis on March 13. Prices reach pre-March 13
Link / USD parity
Link / USD parity is $ 3.64 at the time of writing. Chainlink broke the all-time record for $ 4.95 on March 4, 2020 (last month). Link lost 26.4 percent of its value compared to this period. However, Link is much better compared to other cryptocurrencies. Bitcoin is 65% compared to its all-time high; Ethereum is 88% less valuable and Ripple's XRP is 95% less valuable.
Naturally, we can claim that the crypto money closest to the new record is Chainlink.
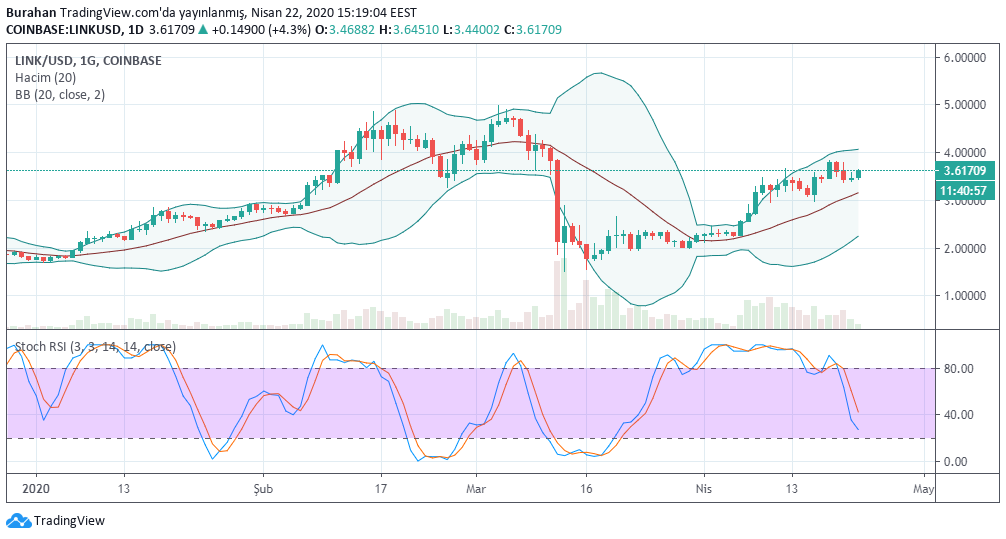
Chainlink price chart and analysis
Based on the Bollinger Bands (BB), we see that the resistance level for Chainlink in the medium term is around $ 4 and the support level in the 2.25 band. The wide range of BB shows that there may be serious fluctuations in prices for a while.
Chainlink technical analysis, Chainlink price chart and Link / USD parity
RSI values are too far from the overbought territory, which gives Chainlink investors hope. There is an area where prices can move upwards for a while.
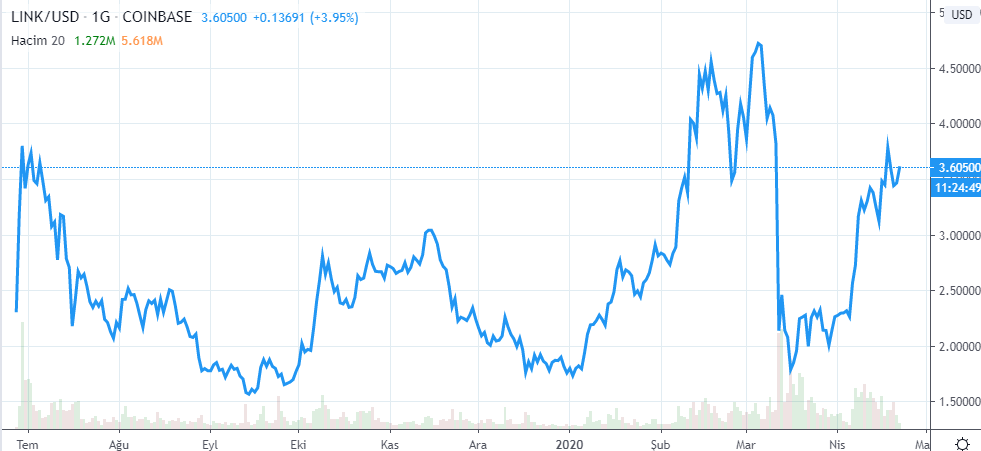
The long-term Chainlink price chart since July 2019 is given below.