
Use Point and Figure Charts to easily find support and resistance
Introduction
Support and resistance levels are easily found on a Point and Figure (P&F) chart. A P&F chart shows a column of stacked Xs or Os. A column of Xs show an increase in price and a column of Os show a decrease in price.
To make a P&F chart it is necessary to select:
- a unit price
- the reversal amount or “box size”.
A new X or a new O is put on the chart when the price moves at least one unit of price in either direction. The average true range (ATR) is a good selection for the unit price. The ATR is a good indicator of price volatility. The true range (TR) is the difference between the high price and low price for a selected time period. The ATR is the calculated average for the TR for a 14-day time period.
All Xs or Os are shown on different columns. The decision to change from a column of Xs to a column of Os is made from the box size. When the price moves in the opposite direction by more than the box size, new column with the other sign is started. The typical selection for the box size is 3. A value of 2 or 1 may also be selected, but this can result in chart patterns that are too irregular.
P&F chart for Bitcoin
Here is a P&F chart from TradingView for Bitcoin (BTC). It uses the following values for unit price and box size:
- the unit price is the 14-day average for the TR
- the box size is 3.
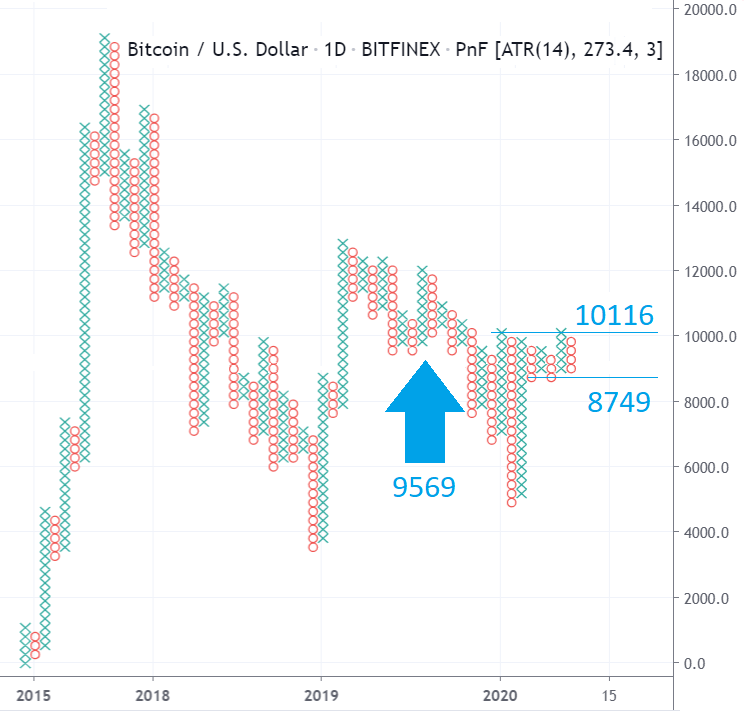
Support and resistance levels are easily seen in the P&F chart for BTC. Note the “big blue arrow” that shows support at $9569. This level was touched three times before price moved down.
At this time, the support and resistance levels for BTC are also easily seen. They are as follows:
- support = $8749
- resistance = $10116
Conclusion
Support and resistance levels are easily found on P&F charts. At this time, BTC is in a trading range with support at $8749 and resistance at $10116.
Note 1: BTC P&F chart from https://www.tradingview.com/.
Note 2: This post is for information purposes only. It is not intended to be investment advice. Seek a duly licensed professional for investment advice.


