
Hello to my friends who love life and keep smiling despite all kinds of negativity. In this article, I will tell you about "FIBONNACI ARRAYS", which are indispensable elements of technical analysis in cryptocurrency markets. I will try to explain it as simply as possible. Let's learn together…
A little boring but a little technical detail;
The Fibonacci Sequence was discovered by Leonardo Fibonacci. The Fibonacci Sequence is a series of numbers obtained by adding each number to the number before it. The feature of the numbers in the Fibonacci Pattern is that when the numbers in the Fibonacci sequence are compared with the previous ones, the series progresses by approaching the golden ratio.
The division of the numbers in the Fibonacci sequence to the previous number and approaching the golden ratio and the fact that the golden ratio is among the objects in our lives made these numbers important and mysterious. The golden ratio included in the Fibonacci Sequence was found by the ancient Egyptians. The Greeks, like the Egyptians, used this number in architecture. It is used in financial markets today.
The Fibonacci Sequence is used in estimating the value of financial assets in the financial sector. It is the golden ratio that we can reach with the Fibonacci Sequence used in technical analysis applications. Generally used rates are 1.618 and 1.232.
The most important ratios used for Fibonacci number strings can be referred to as 0.618, 0.500, 0.382. However, the ratios of 0.236, 0.764 are also used occasionally.
There are different types of Fibonacci sequences according to my usage area.
Hotfix (Popular)
Extension (Popular)
Time intervals
Springs
Fans
Let's briefly talk about the time intervals, springs and fans that are not used much but I want you to know. For my curious friends;
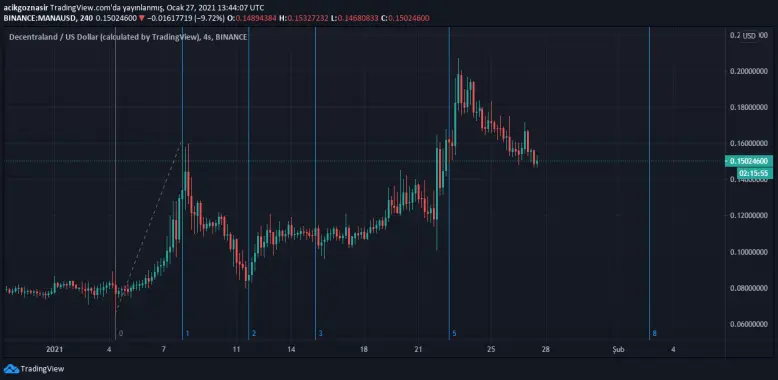
FIBONACCI TIME SPACES;
Price is not the only variable in analysis methods. The time variable should also be examined comprehensively. In this context, Fibonacci Arrays can be used for price changes as well as time intervals. While determining the time intervals, the numbers in the Fibonacci Series are taken as a basis, that is, they are divided into trend day intervals such as 1-1-2-3-5-8-13-21-34. This analysis is used to determine the duration of fluctuations.
FIBONACCI SPRINGS;
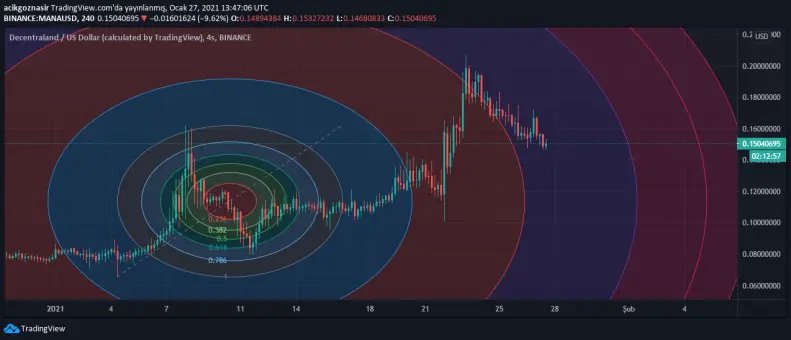
Fibonacci Arcs are created by the reference line drawn from the floor level to the ceiling level of the trend followed by the pair. Arcs drawn to 81.8%, 50% and 38.2% of this line are called Fibonacci Arcs.
In the Fibonacci Springs analysis method, if the price is approaching from above, it is interpreted as support, and if it is approaching from below, it is interpreted as resistance.
FIBONACCI FANS;
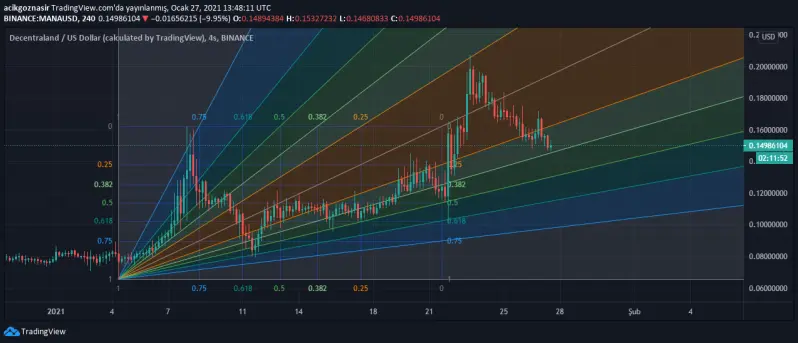
As we have mentioned in other Fibonacci Analysis, a guiding line is drawn on the floor and ceiling points in Fibonacci Fans. This guiding line should be drawn at the ceiling of the intermediate trend, not the main trend.
Let's talk about the most common Fibonacci techniques, extensions and corrections;
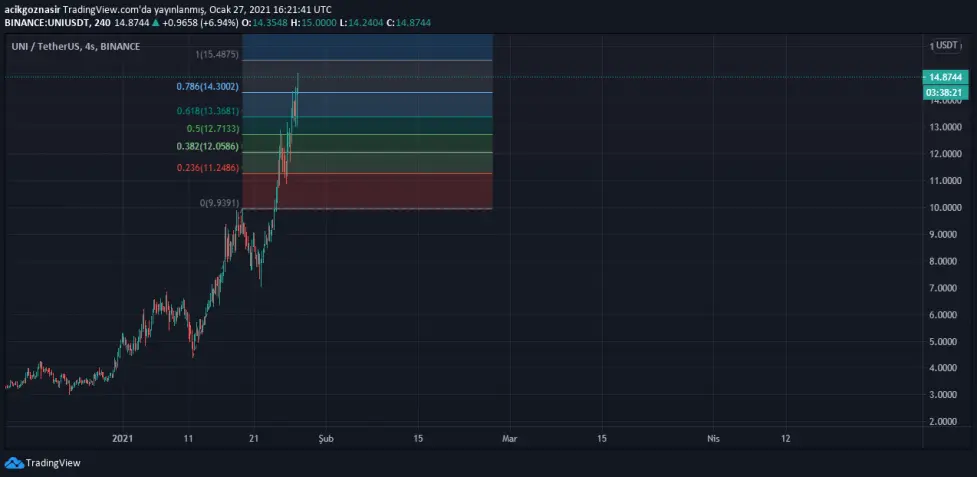
Fibonacci retracement levels indicate the retracement levels of prices before continuing the trend. It is the simple division of vertical distances between selected lower and selected upper (or vice versa) levels into zones at 23.6%, 38.2%, 50% and 61.8%. Prices tend to return to these levels before continuing on the dominant trend.
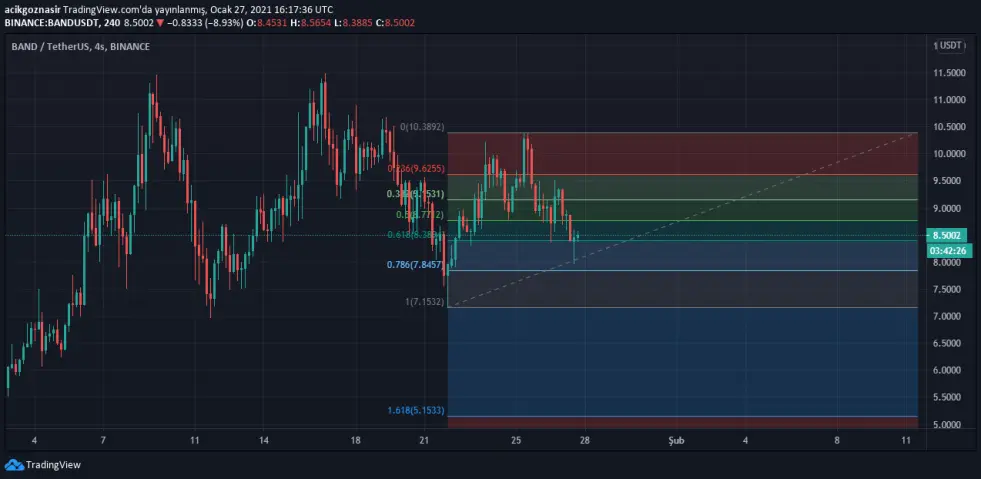
Fibonacci extension levels refer to levels within which prices can reach after the initial fluctuation and corrections. Investors can set these levels as profit taking targets.
Traders can use the Fibonacci retracement levels to buy or set stop losses in an uptrend. In a downtrend, Fibonacci retracement levels can be determined as selling levels.
In finishing…
Fibonacci analysis is not an accurate analysis method. This is because the margin of error is increasing in volatile markets such as cryptocurrency markets. For this reason, it is recommended to apply in more stable markets.
Fibonacci lines work as resistance in an uptrend and support in a downtrend. Fibonacci, which works very well in some cryptocurrencies, is not suitable for some cryptocurrencies. For this reason, you should know well the characteristics of the cryptocurrency you are examining.
The Fibonacci indicator is merely the result of a mathematical operation and may not be suitable for investors who expect a logical explanation. Just like all other indicators, the Fibonacci indicator should be used in technical analysis with other indicators and macro factors should be taken into account.
As I always said, listen to everyone, decide for yourself ...
I'm looking forward to your comments. Thanks to your comments, we can shape my next articles together. Let's stay in touch… Take care of yourself so that you and the people around you are happy…






