
The cryptocurrency market, asset classes tied, and other derivatives are in a full bearish swing again, making the relative return on investment and open interest in all asset classes predictive tools for thorough market analysis. The dip never seems to have exhausted its bottom level yet. We would take a look at the performance of the native index assets of the Index Coop for the past (market) quarter.
Defi Pulse Index($DPI)
After the EIP1559, several changes affected some assets. These changes will inform our study and full-scale analysis of the assets in focus. The $DPI will lead this audit as its performance in the last quarter evokes interest. In September, the DPI traded 41.25% down from its all-time high, ATH. However, there was a commensurate performance against the $ETH's where it made a monthly profit of 11.42%, quarterly profit of 18.18% while keeping an annual lead of 194.97%.
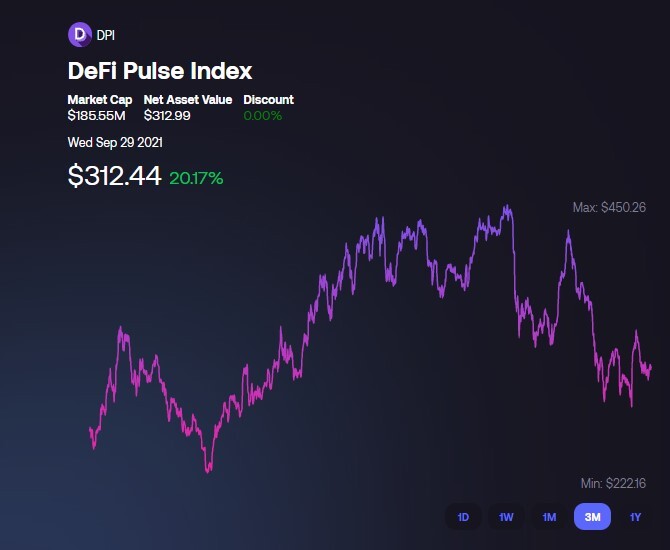
Image showing a 3-month price performance of the $DPI
According to research data from Messari, it hit a quarterly low on July 20, 2021, with a value of $224.40. The $DPI began an upward ascent and climaxed for a quarterly high at $438.73 on August 13, 2021. Many issues characterized the third quarter. Prominent among them is the intensified clampdown on cryptocurrency mining and trading activities by the Chinese government.
The $DPI also recorded an all-time high in its net buy volume of $18,690,576 in July of the Q3, making a 702% increase from the previous record high, which was the Q2 net buy volume at 2,662,060. This net buy volume shows a proportionate measure of momentum, indicating an increasing demand for the $DPI. The $DPI unit supply volume is also another metric that has been on a steady rise, reaching an all-time high with a value of 600,156 in September.
Continuously, the DPI hit a record in TVL (total value locked) in September (Q3), eclipsing the previous quarter’s record of $210,871,509 in total volume, 44,934,728 in incentivized volume and 165,936,781 of unincentivized volume, and $232,775,541.
Metaverse Index ($MVI)
The default design of the $MVI places it as the index of choice that captures the count or trend for entertainment, sports, and businesses in virtual environments gives it a lead in the balance of assets. Over the third quarter, the MVI returned a whopping +145.39%.
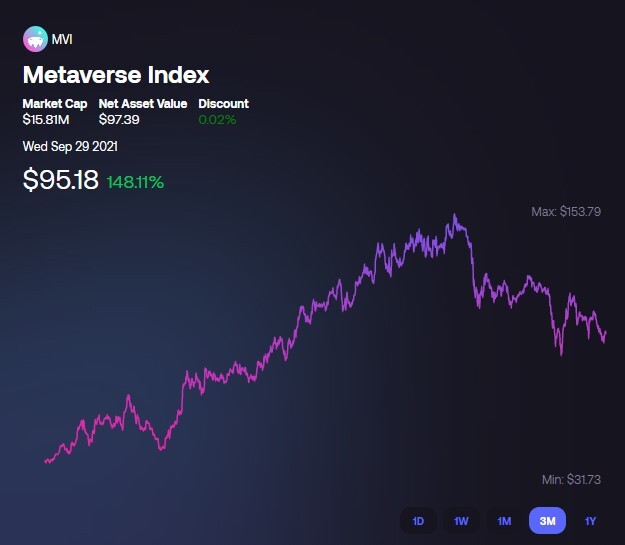
Movement of the MVI captured within a three-month price chart
This significant success of the MVI might rightly be in connection with the surge of NFT and gaming transactions during this period. In a report by Reuters, Sales volumes recorded on the largest NFT trading platform, OpenSea, hit $1.9 billion in August, which was more than ten times March's $148 million. In contrast, in January 2021, the monthly volume of NFT transactions recorded on the platform was a little over $8 million.
Despite the strength of its return over the third quarter, where it reached an all-time high, the $MVI has traded a net negative 26.5% from its all-time high of $155.20. This movement is also a function of the reduced activity in the NFT market. The NFT craze sparked off interest and has died down slowly. The market capitalization of NFT marketplaces rose by 1785%, from $23 million at the beginning of this year to a staggering $432 million.
The $MVI trading volume at the period peaked on August 20, 2021 trading above the 7-day moving average at $1,933,520, and volume pegged at $4,494,664, trading above the previous record high set by the $MVI in April where its 7-day moving average net asset price was at $2,354,019, and volume pegged at $3,870,452.
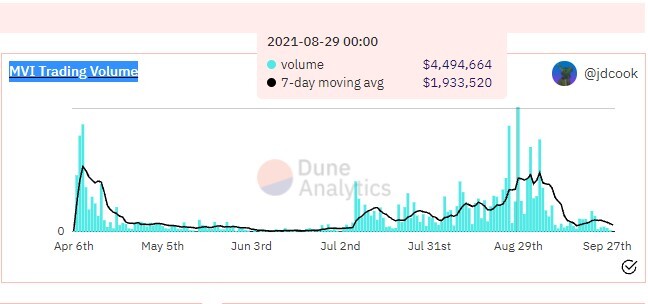
MVI Trading volume, April-September 2021
A peer review of indices in the virtual and augmented reality Web 3.0 protocol shows that the $MVI did not perform well. In the past 30 days, it has just returned above the rest of the assets, making a net negative growth of 26.85%.
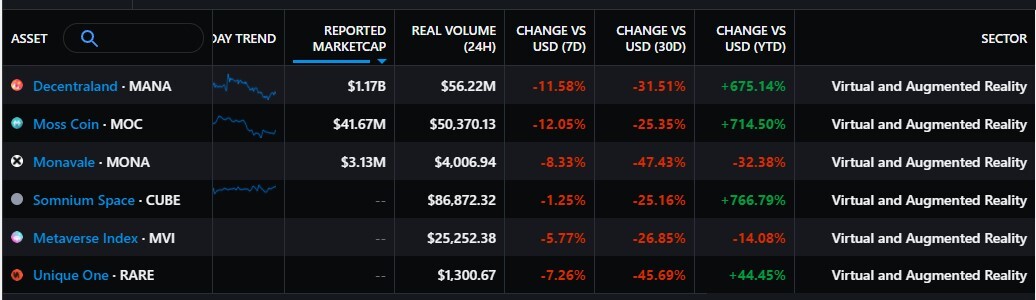
Table showing the performance of assets under the virtual and augmented reality sector
Ethereum 2x Flexible Leverage Index(ETH2x-FLI)
A peer review of indices in the virtual and augmented reality Web 3.0 protocol shows that the $MVI did not perform well. In the past 30 days, it has just returned above the rest of the assets, making a net negative growth of 26.85%.

A graphical representation of ETH2x-FLI Daily Revenue
A metric where the ETH2x-FLI looks disturbing is the Cumulative Revenue / Cost. The cost revenue ratio is an important metric that tracks the efficiency of a company's operation and compares its expenses to earnings. When we take account of the nature of this growth, it looks steep and fragile on a surface level. However, the growth of the Ethereum blockchain, the intensity of TVL/AUM of Defi projects, and the anticipated changes create a belief in the organic nature of the changes recorded. We understand that volatility is an intrinsic variable in the volumetric analysis as it predicts (positively or negatively) the randomness, equilibrium, or efficiency of the market operations.
As always, investors are on the lookout for the red flags. Some of those red flags include higher maintenance expenses, operating income, or expenses that may reflect on the performance of the asset in the long run. The ideal is Cumulative Revenue to Cost ratio should be between 60% and 80% - the lower it is, the better.
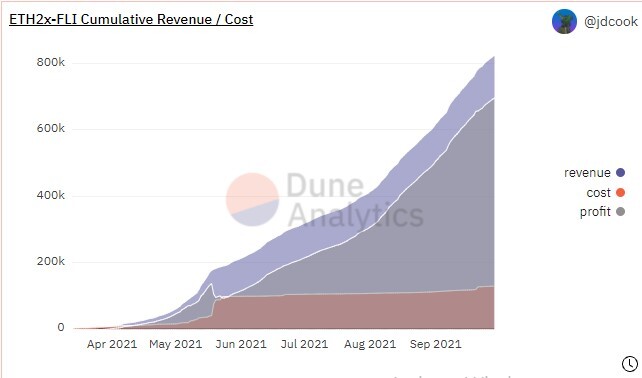
Illustration of the Revenue/Cost/Profit
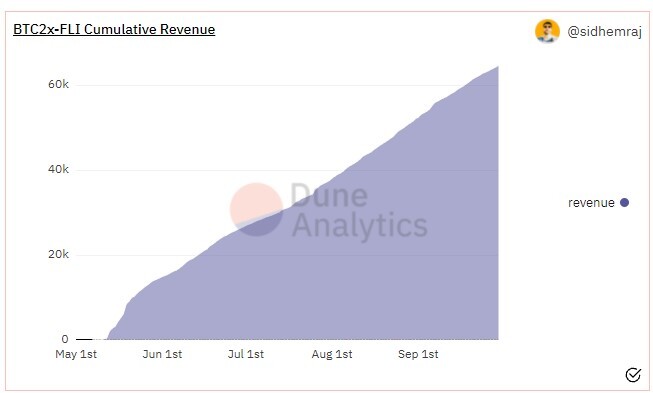
Bitcoin 2x Flexible Leverage Index (BTC2x-FLI)
The BTC2x-FLI enables market participants to take on leverage while minimizing the transaction costs and risks associated with maintaining collateralized debt. In the studied timeframe, there was an observed reduction in the mint volume over the time of this observation, far below the 7-day moving average. With the count of the address exposure over 500 for the first time in Q3, BTC2x-FLI- Trading-Volume remained choppy and non-directional, consolidating around the 7-day moving average.`
The COMP USD Accrued Over Time/ COMP USD EARNING continued on an upward trajectory breaking the $100k mark on the price-time chart.
We can conclude by looking at the cumulative revenue of the BTC2x-FLI. In the chart from 1 May – 1 September, there was a steady rise indicating progressive growth. It is necessary to evaluate and sustain the variables that have led to this. Firstly, we must categorize all factors (fixed or variable). Doing this takes a considerable amount of work but the information and profitability it yields are worth whatever amount of work put into it.


