
Most cryptocurrency markets are trying to regain some lost value. Yesterday's dip has triggered a sea of red across the board, although nothing that can't be overcome.
ChainLink Price Flashes Green
There is still plenty of red across the cryptocurrency market charts. As long as Bitcoin doesn't retake the $10,300 level, there will be some uneasy momentum. ChainLink price watchers won't care too much about the overall momentum however. LINK has bucked the downtrend with relative ease and is even looking to note some fresh gains again.
With decent trading volume, a lot can be achieved. ChainLink checks the right boxes here as well, with over $250 million in liquidity. Three of the top 5 trading pairs are LINK/USDT, thus that will be a crucial market. The volume generated by LINK/BTC cannot be ignored either.
LINK/USDT Technical Indicators
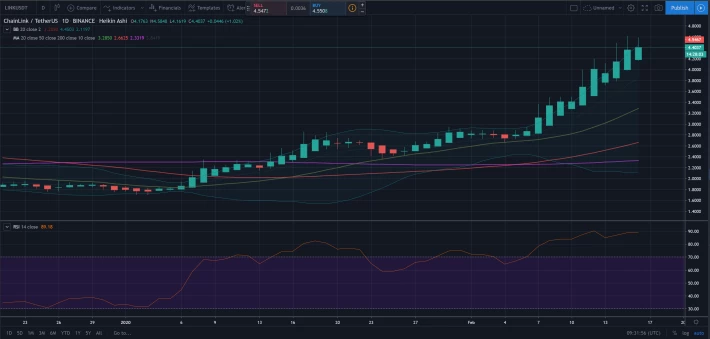
Bollinger Bands: Very wide Bollinger Bands for LINK/USDT. Given the strong trading volume and not crumbling under the downtrend yesterday, that is a very healthy sign. There will be more volatility on the horizon, although that can easily swing either way. A further upward push is not unlikely, yet no miracles should be expected.
Moving Averages: Not much has changed in this department. On the daily ChainLink price chart, the MA20 and MA50 keep moving up rather nicely. Even the MA200 is on the rise ever so slightly. A continuation of the uptrend remains likely, assuming the daily candle wick doesn't overtake the body size.
RSI: Being in overbought territory is almost a meme among alternative cryptocurrencies these days. LINK/USDT has resided in this territory for over a full week and shows no real signs of dropping just yet. That being said, these markets remain volatile and unpredictable first and foremost.
Resistance Levels: The current ChainLink price level may very well act as a temporary resistance. The $4.55-$4.6 territory has been left largely unchecked for this particular market. A new all-time high is certainly possible in the short-term, but sustaining this growth cannot be overlooked either. In the past, LINK briefly hit $4.58, which is well within reach.
LINK/BTC Technical Indicators

Bollinger Bands: Similar patterns for LINK/BTC, which is to be expected given the current uptrend. There are wide-open Bollinger Bands, further strengthening the feeling of overall liquidity and volatility. There is no sign of slowing down in this segment either, which is all traders want to see.
Moving Averages: The moving averages for LINK/BTC look pretty positive as well. All three MAs are sloping up, although the MA200 is lagging behind quite a bit. Even so, there are healthy signs of a continuing uptrend, although some brief retrace will need to kick in sooner or later.
RSI: More overbought territory here as well, yet the angle is still sloping up. It appears that very few people are interested in selling LINK under the current circumstances. Considering how the amount of LINK on exchanges is slowly on the decline, this trend may continue for quite some time to come.
Resistance Levels: For now, it seems that the 0.0004565 level will be a minor resistance that can keep the market subdued for a few hours. Any higher than that, everything is uncharted territory for ChainLink, thus no one really knows what to expect.






