
While the Tomochain (TOMO) price is resting above several crucial support levels, technical indicators and the wave count suggests that the price has begun to correct.
TOMO Holds on to Support
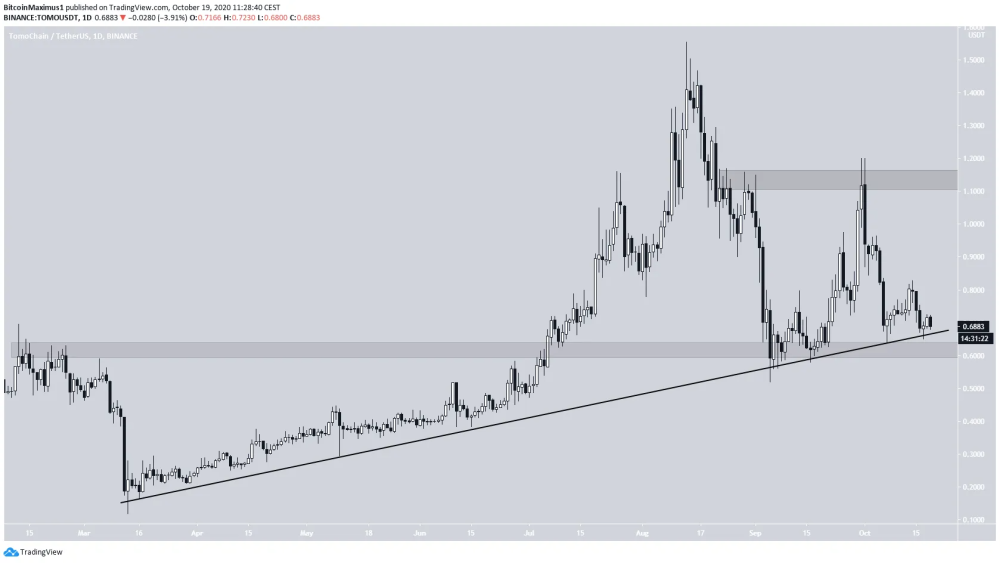
The TOMO price reached a high of $1.55 on Aug 13, but dropped significantly shortly afterward, culminating with a low of $0.52 on Sept 5.
The price then bounced and reached a high of $1.20 on Sept 30 but dropped sharply once more. This move served to validate the $1.15 area as resistance.
However, the price is still trading above an ascending support line that it has been following since reaching a bottom on March 13, and is trading above the $0.63 support area. As long as it does so, the possibility of continuation remains valid.
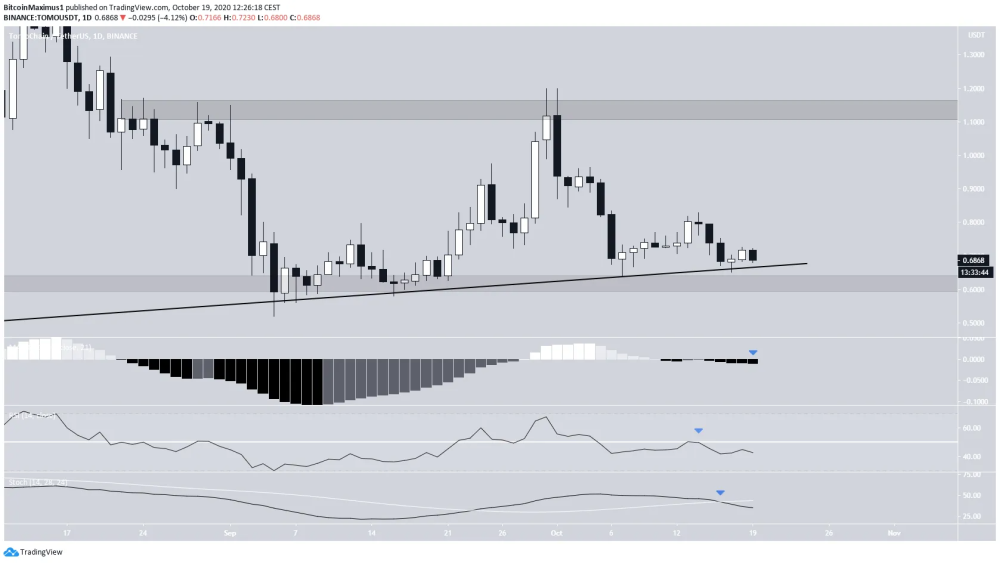
Despite the considerable support below the current price, technical indicators on the daily time-frame have turned bearish.
- The MACD has crossed back into negative territory.
- The RSI is trading below 50.
- The Stochastic Oscillator has made a bearish cross.
Therefore, any price rallies are considered corrective, while the main trend is considered bearish.
Short-Term Movement
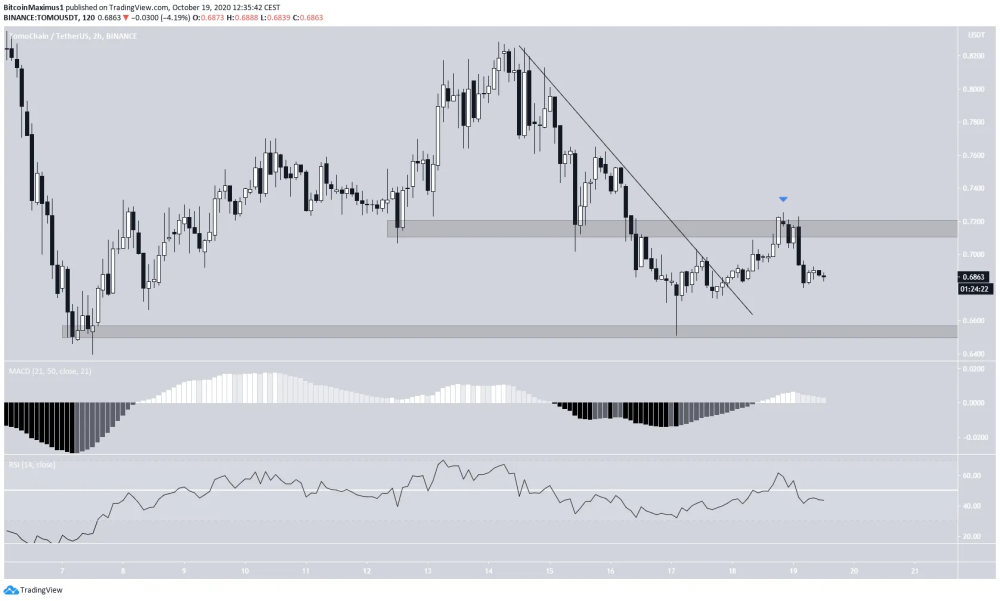
The price has fallen below both the $0.75 and $0.70 support areas. After attempting to initiate an upward move, TOMO was rejected by the $0.70 area.
Technical indicators show that the move has lost strength, and a fall towards the range low at $0.65 is likely.
Wave Count
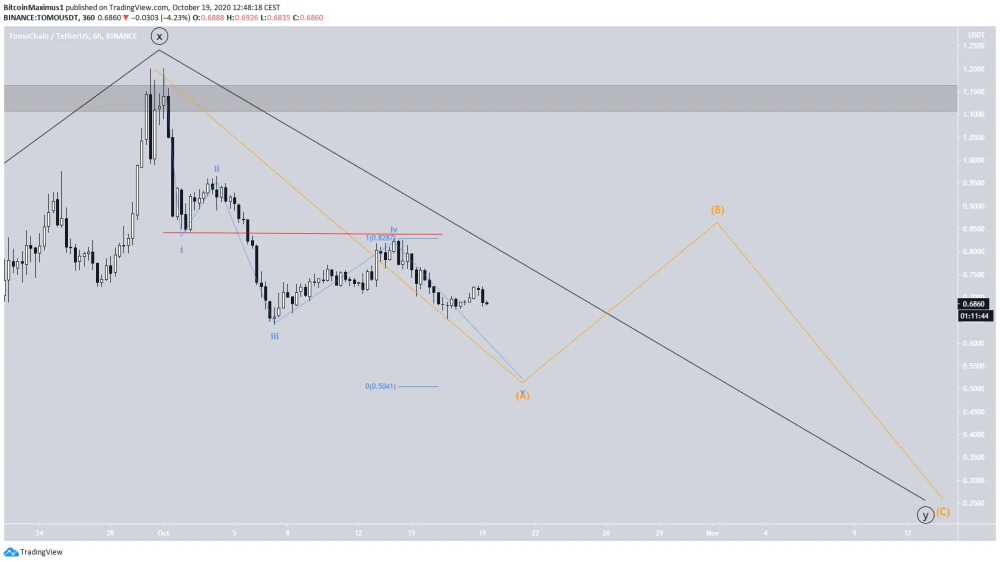
Since the previous Aug 13 high, the TOMO price seems to have begun a complex W-X-Y corrective structure (shown in black below), currently trading in wave Y.
Since the W wave is created by three subdivisions and X did not retrace more than the 0.618 Fib level, the correction is a W-X-Y instead of an A-B-C.
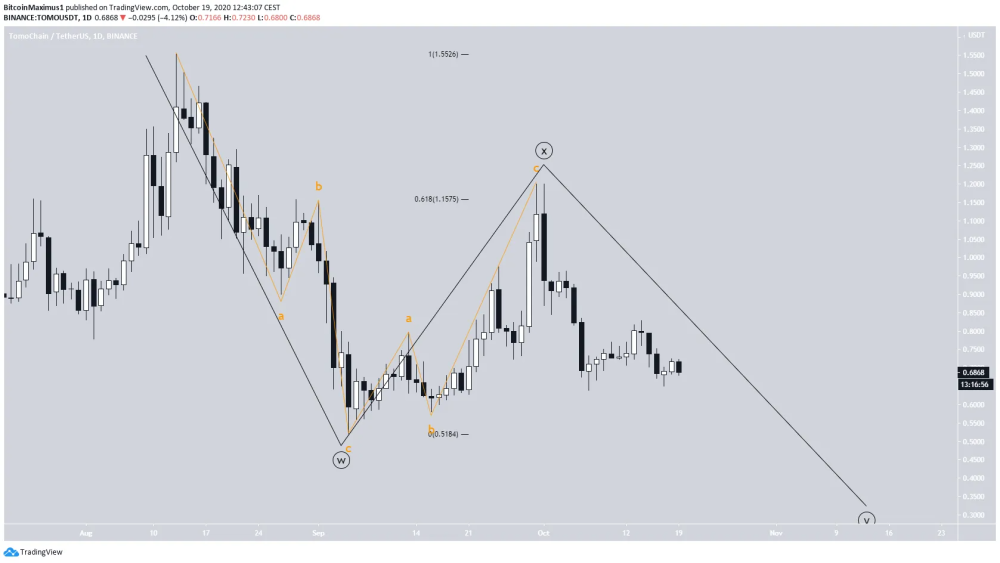
The Y wave is comprised of another A-B-C correction (orange), in which the price is still in the A wave. We can outline a bearish impulse (blue) for the A wave, which gains more validity due to a lack of overlap (red solid line).
Therefore, the price should decline to $0.50 before beginning a corrective move up. Due to Elliott wave rules, more specifically the fact that wave 3 cannot be the shortest, a fall that would take the price lower than $0.50 would invalidate this particular wave count.
What do you think we will see in the coming week / month? If you like this content, consider tipping the article / following me, so more people see this content and we get a nice discussion going on.
Also, If you are interested in trading, I would suggest you try out BeInCrypto's free Telegram chat. I am there and it is growing very quickly (over 7,900 members) where they discuss the market and share interesting content. They also have a free premium channel where they have a cryptocurrency trading course and daily trading signals. If you are interested, you can click here.
Until next time, stay classy crypto world!


