
Please note, that these are projects in the top 100 marketcaps, there are others who have smaller marketcaps that also grew in value. During the week of June 7th to June 14th, the biggest altcoin gainers were:
- Amp (AMP) : 50.26%
- Quant (QNT) : 31.97%
- Theta Fuel (TFUEL) : 17.12%
- Chiliz (CHZ) : 6.61%
- Revain (REV) : 2.04%
AMP
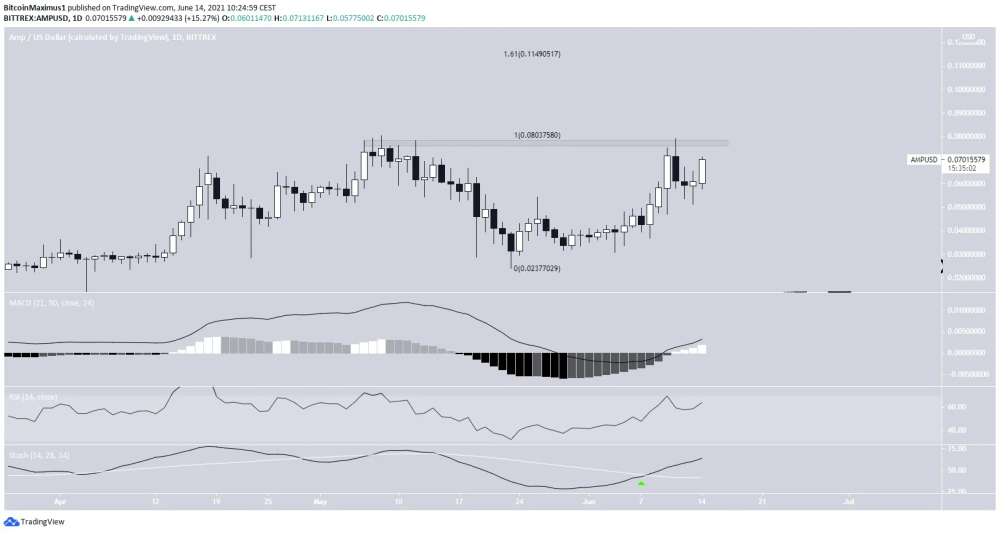
AMP has been moving upwards since May 23, when it reached a low of $0.023. The increase continued until a high of $0.079 was reached on June 11, barely failing to reach a new all-time high price.
In addition, AMP could not reach a close above the $0.077 resistance area.
Despite the rejection, technical indicators in the daily time frame are bullish. The RSI is attempting to move above 70 and the MACD is positive. Furthermore, the Stochastic oscillator has made a bullish cross (green icon).
If AMP manages to close above $0.077, the next resistance would likely be found at $0.11.,This target is the 1.61 external Fib retracement when measuring the most recent drop.
QNT
QNT has been increasing since May 23, when it bounced above a long-term ascending support line. The line has been in place since Jan. 30.
Currently, QNT is making an attempt at reaching a new all-time high above $64.33.
Similar to AMP, technical indicators are bullish. The RSI is above 50, the MACD is positive, and the Stochastic oscillator has made a bullish cross.
If a breakout occurs, the next resistance would be found at $89.20.
TFUEL
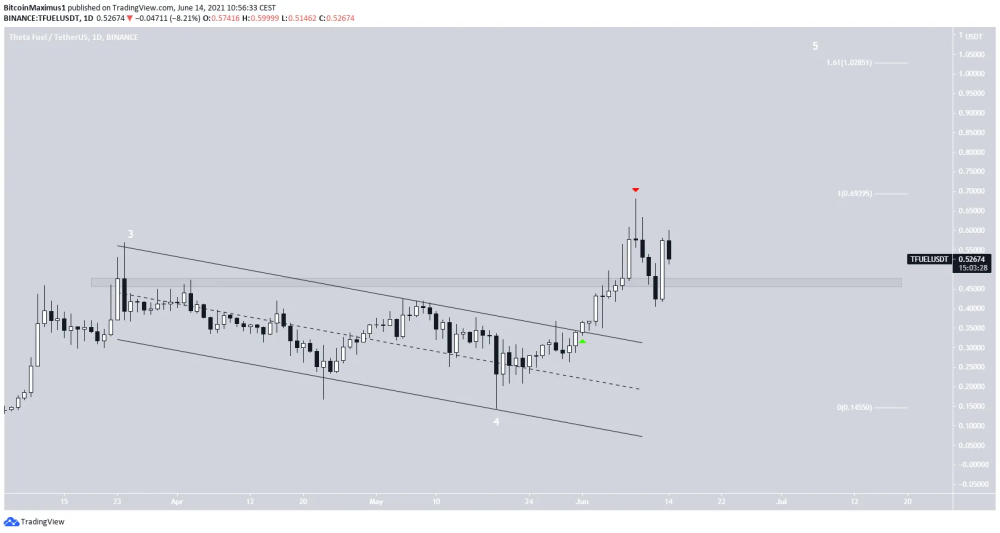
On June 1, TFUEL broke out from a descending parallel channel (green icon). It continued increasing until it reached a new all-time high of $0.679 on June 9. However, it created a shooting star candlestick the same day and has been moving downwards since (red icon).
While it’s possible that this was the top of a bullish impulse, an extension could take TFUEL all the way up to $1.
On June 13, TFUEL bounced and validated the $0.47 area as support. The trend is considered bullish as long as TFUEL is trading above this level.
CHZ
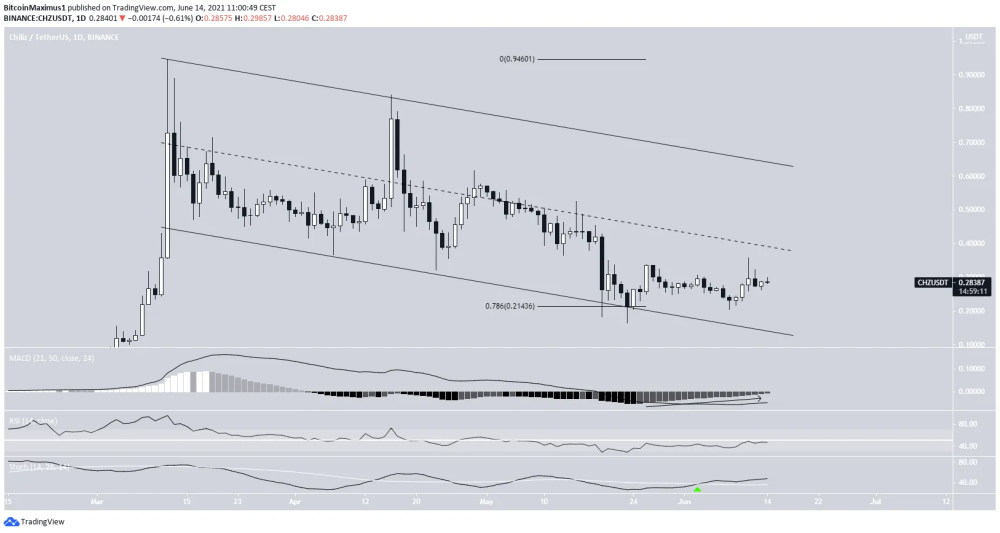
Since March 12, CHZ has been trading inside a descending parallel channel. These structures often contain corrective movements.
While CHZ has been increasing since May 23, it’s still trading inside the lower portion of the channel. It has to reclaim the middle of the channel in order for the trend to be considered bullish.
Technical indicators are relatively neutral, failing to confirm the direction of the trend.
REV
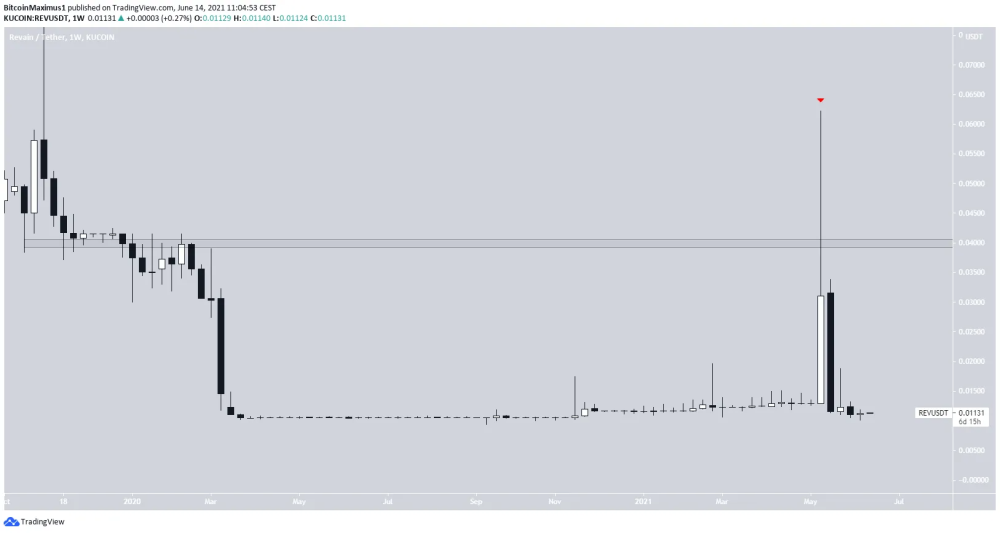
On May 11, REV was rejected by the $0.04 area and has been moving downwards since. This created a very long upper wick (red icon).
REV is currently trading at its all-time low levels near $0.01.
The movement does not have a clear structure and looks very out of the ordinary.
What altcoins are you currently eyeing up and why? Who do you think will be the top gainers this week? If you enjoy this sort of content, consider following me and also tipping the article.
Also if you are on Twitter, why not give me a follow and start some conversations? You can find me here - https://twitter.com/dizzlecrypto.
Until next time, stay classy!


