
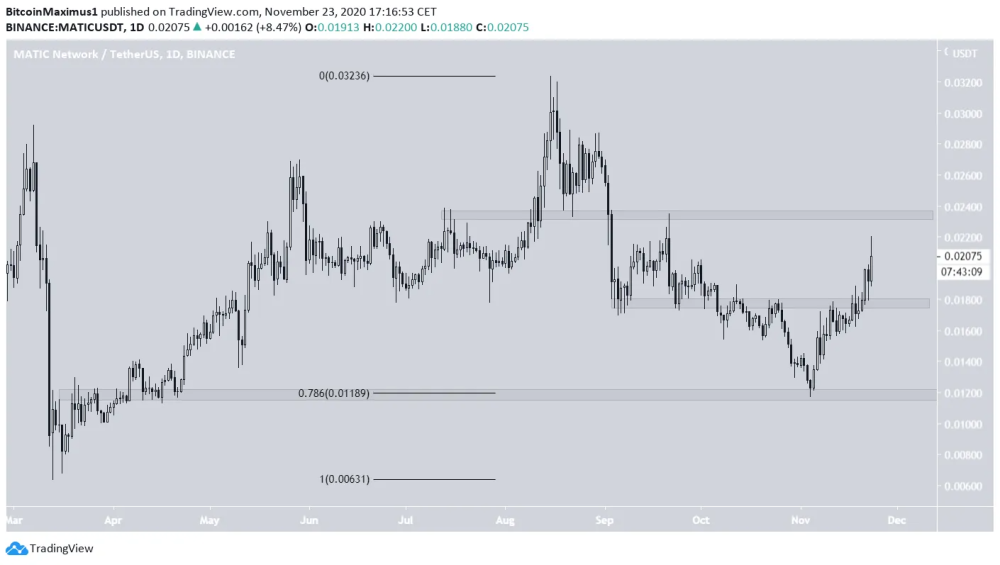
The Matic Network (MATIC) price has been increasing since reaching a bottom on Nov 4.
On Nov 4, the MATIC price reached a local low of $0.0110, and finally reversed the downward trend which had begun on Aug 15.
The low coincided with the 0.786 Fib retracement level of the entire previous upward move, increasing its significance.
MATIC Begins to Bounce
The price began to bounce immediately after the low and has already reached a high of $0.0220, breaking out from the $0.0180 resistance area in the process.
This area is now likely to act as support, while the next closest resistance area is found at $0.0235, an area that has to be cleared before the price could make an attempt at reaching the August highs near $0.0320.
Will the Upward Move Continue?
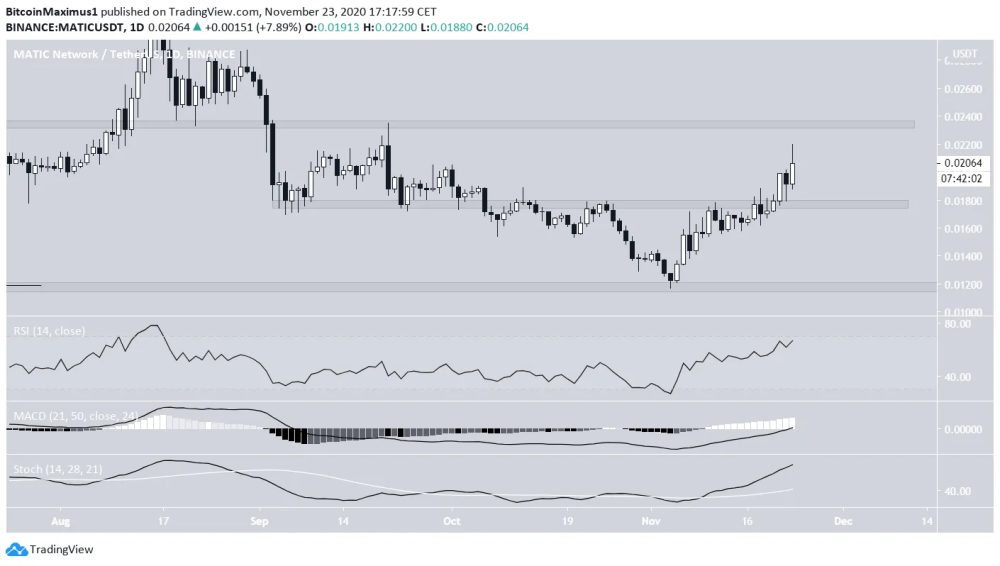
Technical indicators in the daily time-frame are bullish.
The RSI, MACD, and Stochastic oscillator are increasing, and there are no bearish divergences.
Therefore, the upward move is expected to continue until at least $0.0235.
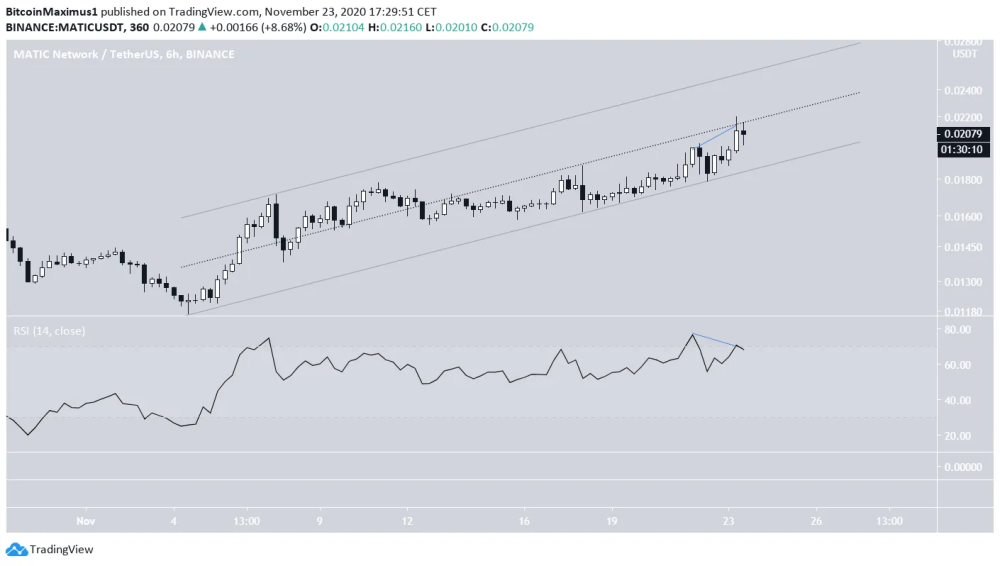
The shorter-term 6-hour chart shows that the price is facing resistance from the middle of a parallel channel, inside of which it has been trading in since the upward move began on Nov 4.
Furthermore, the RSI has generated bearish divergence, a sign that a short-term decrease is likely. MATIC is expected to drop towards the support line of the channel near $0.0185. However, as long as the channel remains intact, MATIC is expected to continue moving upwards towards the previously outlined resistance areas.
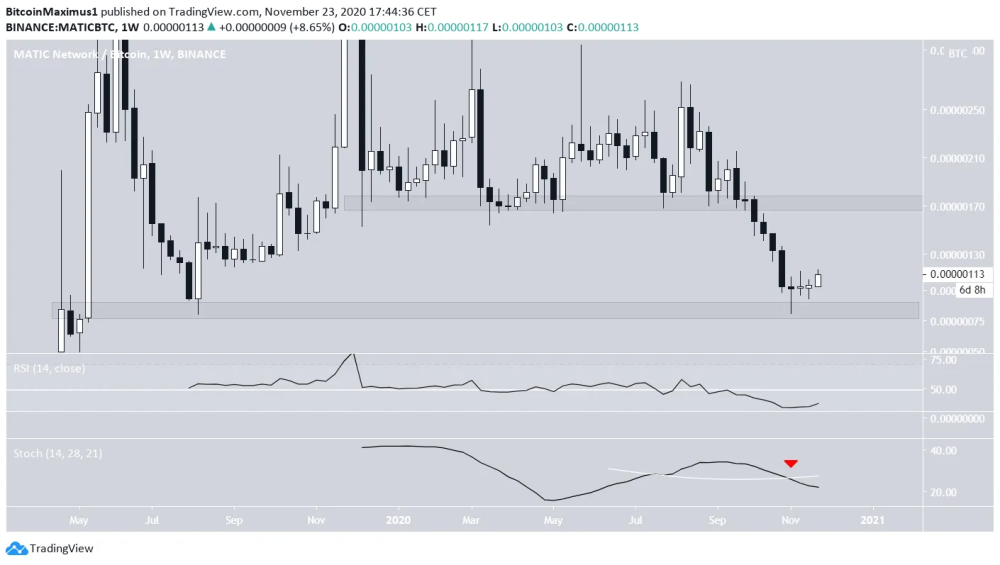
MATIC/BTC
The MATIC/BTC price reached a low of 90 satoshis on Nov 4 and began a slight bounce.
Despite the increase, the trend is still bearish, since the price is not even close to the previous support area.
Until the price is able to successfully flip the 170 satoshi area, the trend is considered bearish. Technical indicators have not given any bullish reversal signs.
Conclusion
While the MATIC/USD price is expected to increase towards the closest resistance area, it is not yet clear whether the long-term trend is bullish or bearish.
On the other hand, the trend for MATIC/BTC is still bearish, despite the fact that the price has begun to bounce.
Also, If you are interested in trading, I would suggest you try out BeInCrypto's free Telegram chat. I am there and it is growing very quickly (over 8,900 members) where they discuss the market and share interesting content. They also have a free premium channel where they have a cryptocurrency trading course and daily trading signals. If you are interested, you can click here.
Until next time, stay classy crypto world!


