
The Litecoin (LTC) price has finally broken out from the $85 resistance area, something it had been struggling to do for more than a year.
Both the LTC/USD and LTC/BTC pairs should continue moving upwards towards the targets given below.
Breakout From Long-Term Resistance
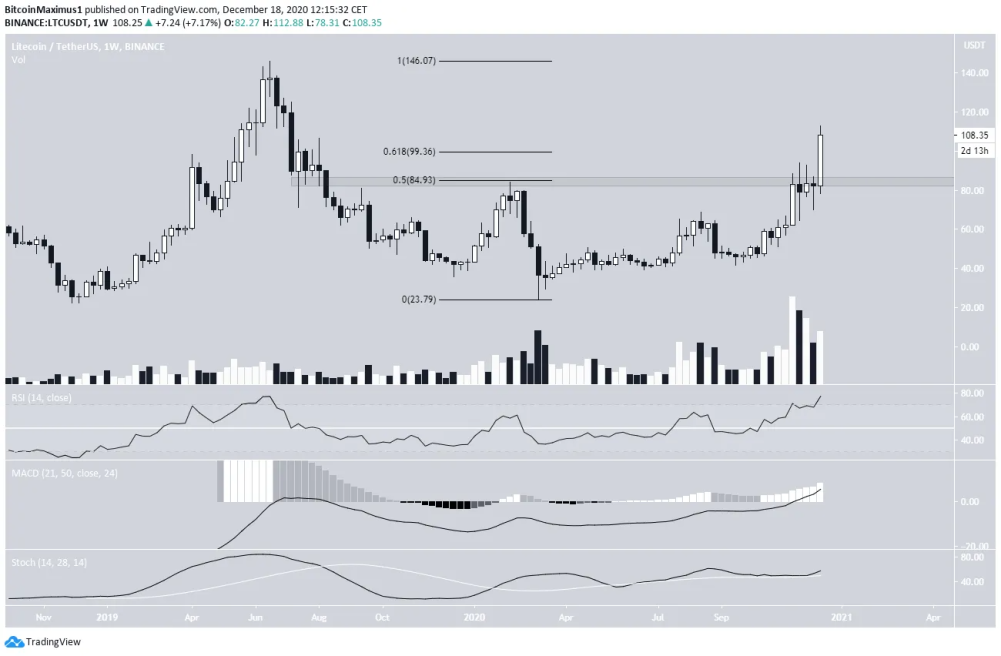
The weekly chart shows that LTC has finally moved above the $85 resistance area, something it has struggled to do since July 2019. While it has yet to reach a close above this area, it’s almost certain to do so, barring an unforeseen significant dump.
Volume picked up during the breakout, and indicators are all bullish, increasing the breakout’s legitimacy. The next closest resistance area is at $145.
Future Movement
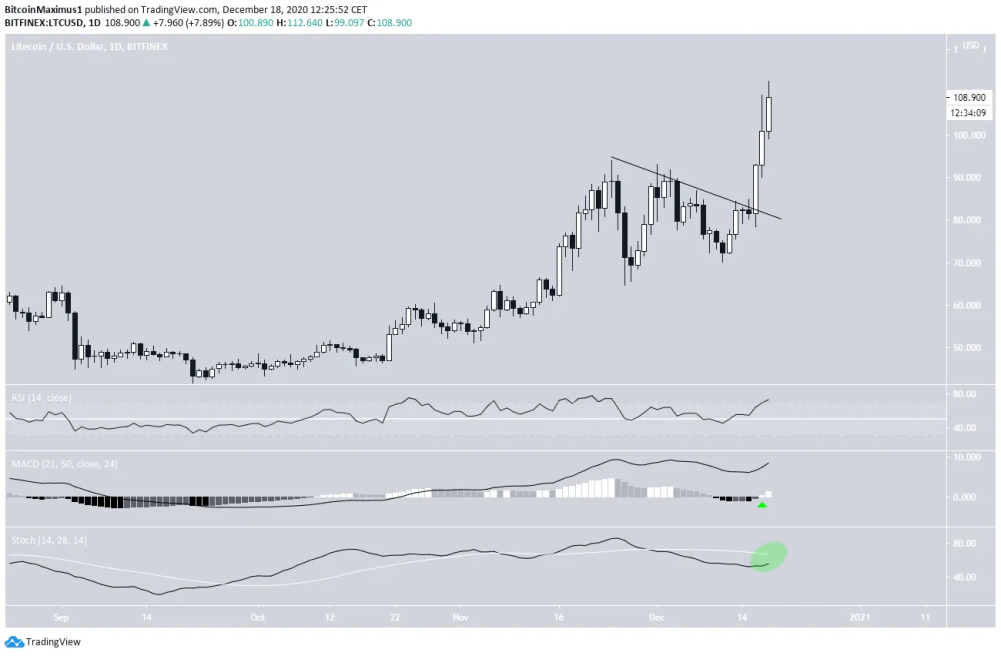
The daily chart shows that LTC accelerated its rate of increase as soon as it broke out from a descending resistance line.
Technical indicators are bullish and do not show any weakness, supporting a potential target around the $145 area.
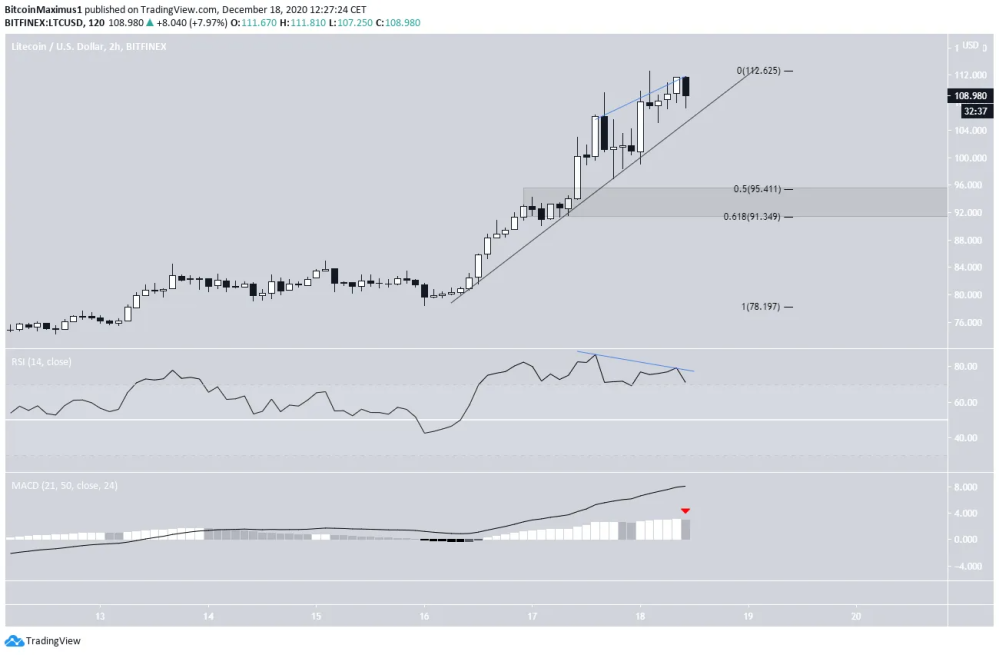
However, the two-hour chart shows the first signs of weakness.
LTC is following a very steep ascending support line, which is likely unsustainable in the long-run. In addition, both the RSI and the MACD have formed bearish divergence, a sign of a weakening trend.
Therefore, a decline towards the $91 – $95 support area, the 0.5 – 0.618 Fib retracement levels could occur before LTC resumes its upward movement.
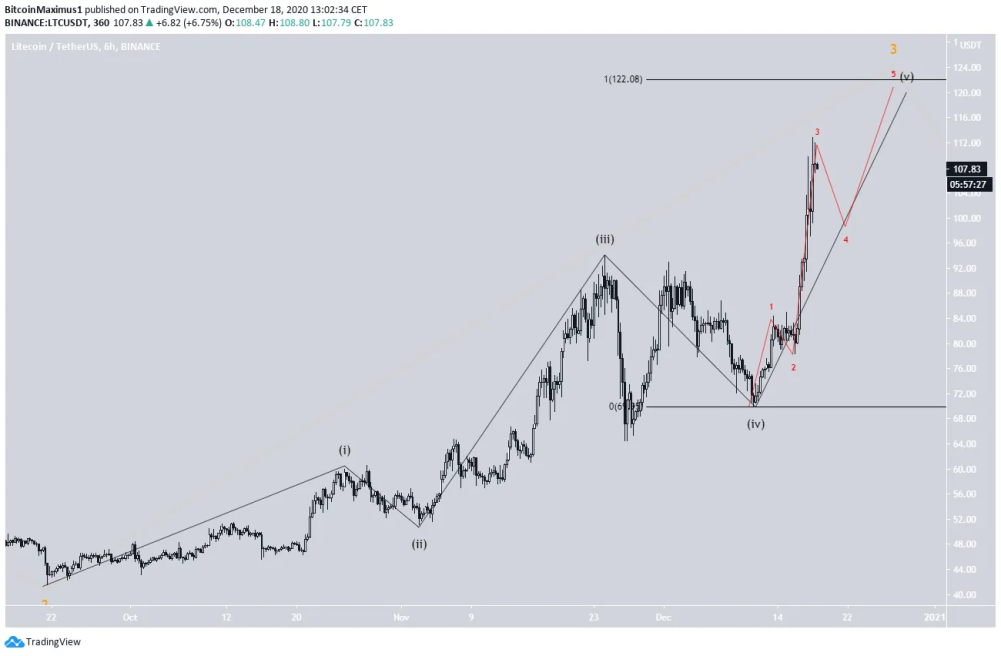
Wave Count
The wave count suggests that LTC began a bullish impulse in March, currently trading in cycle wave 3 (shown in white below). It is also in the midst of a 1-2/1-2 wave formation, currently being in wave 3 (orange).
A target for the top of wave 3 (orange) is at $118, while a target for the top of cycle wave 3 (white) is near $147, also fitting with the resistance area outlined in the first section.
On the other hand, a decline below the wave 1 high (red line) at $68.37 would invalidate this particular wave count.
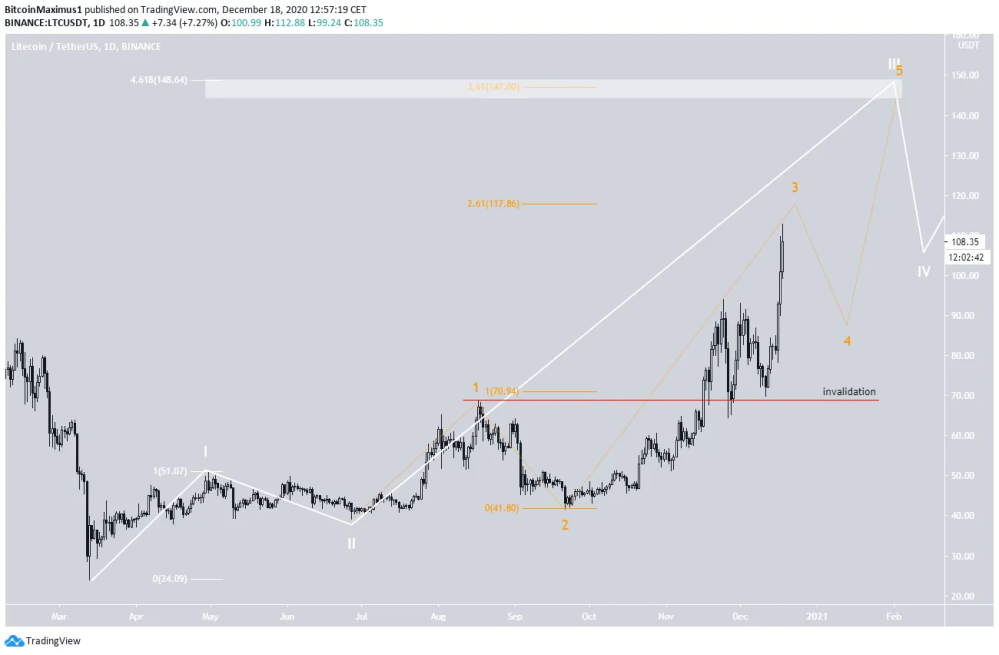
The sub-wave count for wave 3 (black) shows that Litecoin is likely nearing the top of the move, currently trading in the final sub-wave.
Projecting the length of sub-wave 1 – 3 to 4 gives us a target of $122, very close to that of $118 found in the previous section. After wave 3 is completed, a correction will likely occur before LTC moves towards $145.
The minor sub-wave count is shown in red.
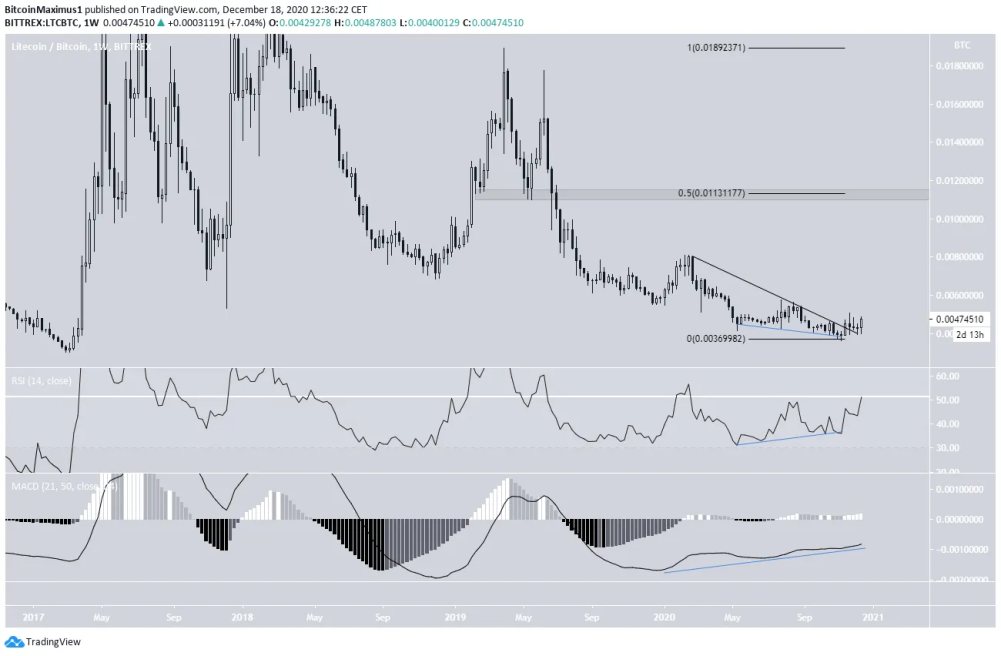
LTC/BTC
The LTC/BTC chart shows that Litecoin was indeed trading very close to its all-time lows of ₿0.003 in March 2017.
However, the price move and technical indicators appear quite bullish.
LTC has broken out from a descending resistance line and validated it as support afterward. In addition, both the MACD and the RSI have formed considerable bullish divergence.
If LTC begins to move upwards, which is likely, there is no significant resistance all the way up to ₿0.0111, the 0.5 Fib retracement level of the previous decline.
Conclusion
To conclude, the LTC/USD and LTC/BTC pairs should eventually move towards $145 and ₿0.0111, respectively.
Also, If you are interested in trading, I would suggest you try out BeInCrypto's free Telegram chat. I am there and it is growing very quickly (over 10,000 members) where they discuss the market and share interesting content. They also have a free premium channel where they have a cryptocurrency trading course and daily trading signals. If you are interested, you can click here.
Until next time, stay classy crypto world!


