
On Oct 8, the ChainLink (LINK) price broke out from a descending resistance line that had been in place for 52 days.
While a short-term decline could occur, the price should resume its upward move afterward.
LINK Breaks Out From Resistance
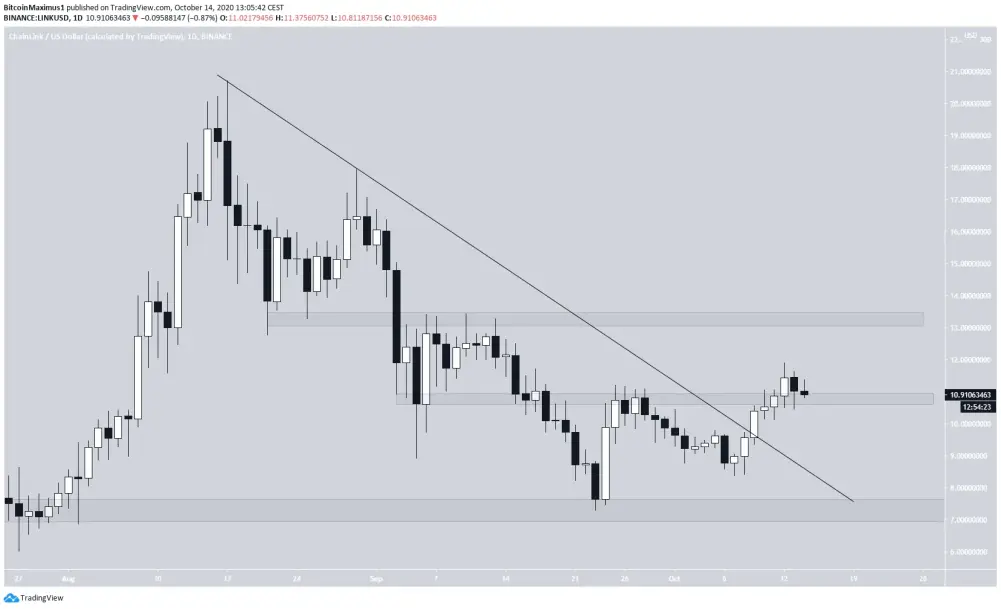
The LINK price has been moving downwards since it reached a high of $20.71 on Aug 17. The fall followed a descending resistance line and continued until the price reached a low of $7.28 on Sept 23. LINK has been increasing since.
On Oct 9, the price broke out from this resistance line and continued moving upwards until it broke out above the $9.80 resistance area a few days later. Currently, it is in the process of validating this area as support.
If the price continues to climb, the next resistance area would be found at $13.20. Conversely, a breakdown could take the price all the way down to $7.30.
Bullish Indicators
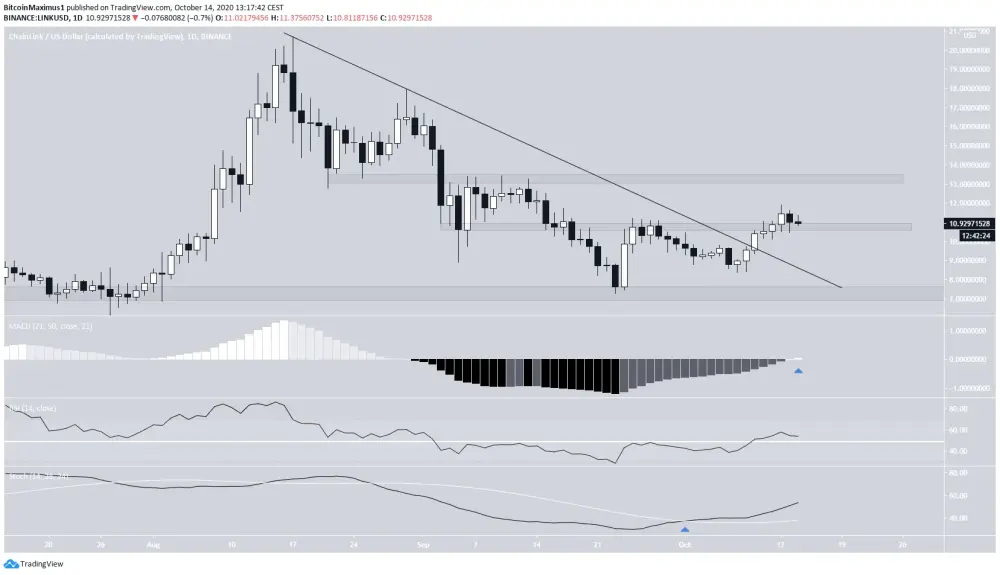
Technical indicators are bullish and support the previous rally towards resistance.
- The MACD has just crossed into positive territory.
- The RSI has crossed above 50.
- The Stochastic Oscillator has made a bullish cross.
Therefore, while the price is expected to move towards $13.20, a look at lower time-frames is required to determine how it will get there.
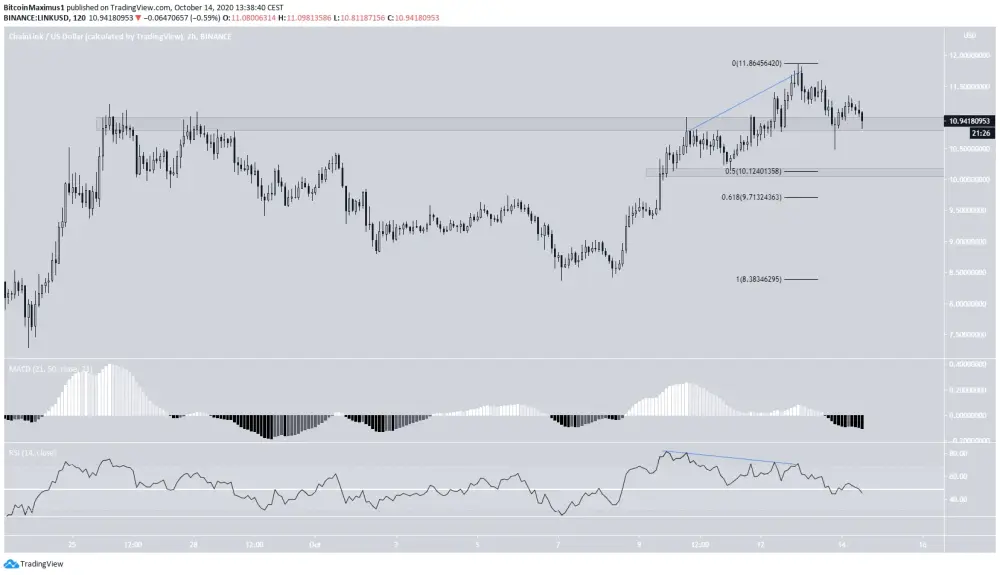
The 2-hour chart shows a breakout from and re-test of the $10.80 area, which previously rejected the price on Sept 26 – 28. The RSI formed bearish divergence, and the price fell afterward as a result, validating the $10.80 area as support and creating a long lower wick.
If the price manages to hold on above this level, it should increase towards $13.20, while a failure to do so would take the price towards the closest support area at $10.12.
If the price falls below the $10.80 area and fails to reclaim it afterward, it would be a major bearish development since the previous breakout would be considered a deviation above the range high. That would mean the price is likely to continue falling.
However, that doesn’t seem likely at the current time.
Wave Count
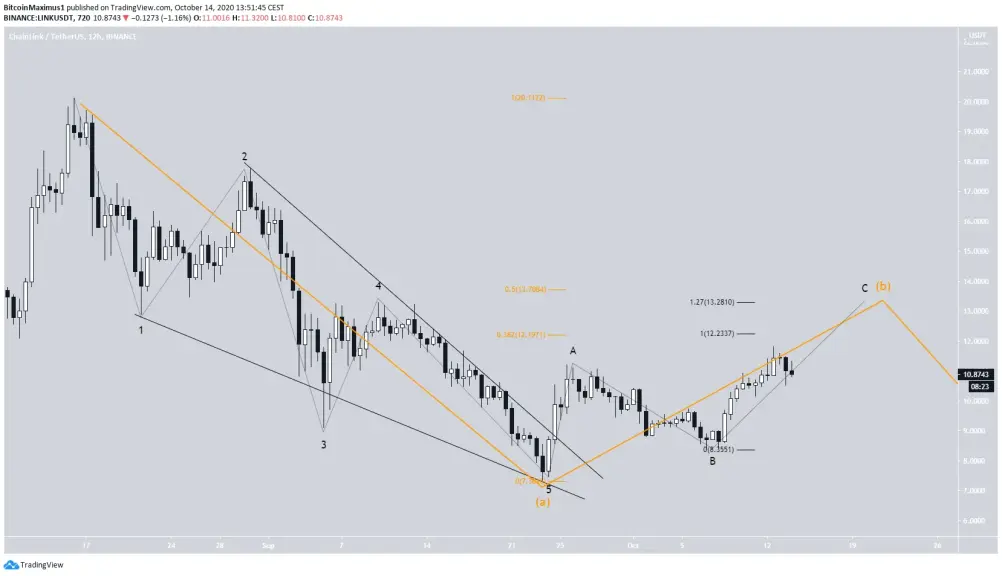
Since the Aug 17 high, the LINK price has possibly completed a bearish leading diagonal (shown in black below), which could have been the A wave of an A-B-C correction (in orange), currently in the B wave.
The B wave is also taking place inside an A-B-C structure (black), and the price is currently in the C wave.
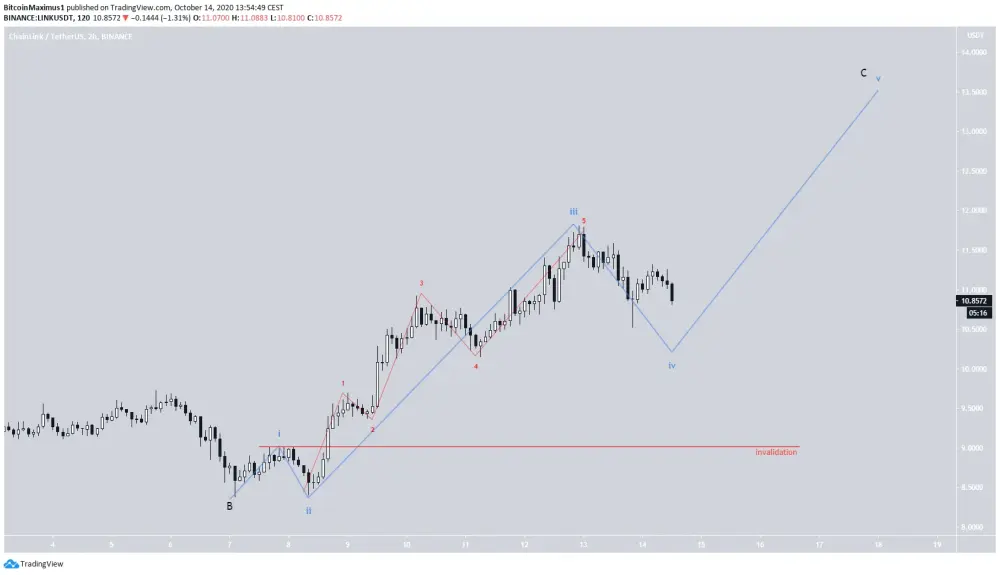
The most likely targets for the top of the C wave are near $12.20 and $13.30 – $13.70, found by the Fib levels of the long and short-term wave A.
A closer look at the C wave reveals that the price has completed sub-waves 1 – 4 (shown in blue below) and is currently beginning wave 5.
Therefore, unless wave 5 is extremely short, the $13.30 – $13.70 area is more likely to act as the top.
To conclude, the LINK price should rally towards the closest resistance area before possibly falling to new lows.
What do you think we will see in the coming week / month? If you like this content, consider tipping the article / following me, so more people see this content and we get a nice discussion going on.
Also, If you are interested in trading, I would suggest you try out BeInCrypto's free Telegram chat. I am there and it is growing very quickly (over 7,900 members) where they discuss the market and share interesting content. They also have a free premium channel where they have a cryptocurrency trading course and daily trading signals. If you are interested, you can click here.
Until next time, stay classy crypto world!






