
The Chainlink (LINK) price is retracing since being rejected by an important resistance level.
Despite the breakdown from a short-term structure, the price is expected to soon begin moving upwards to break out from the current resistance area.
LINK Breakout and Rejection
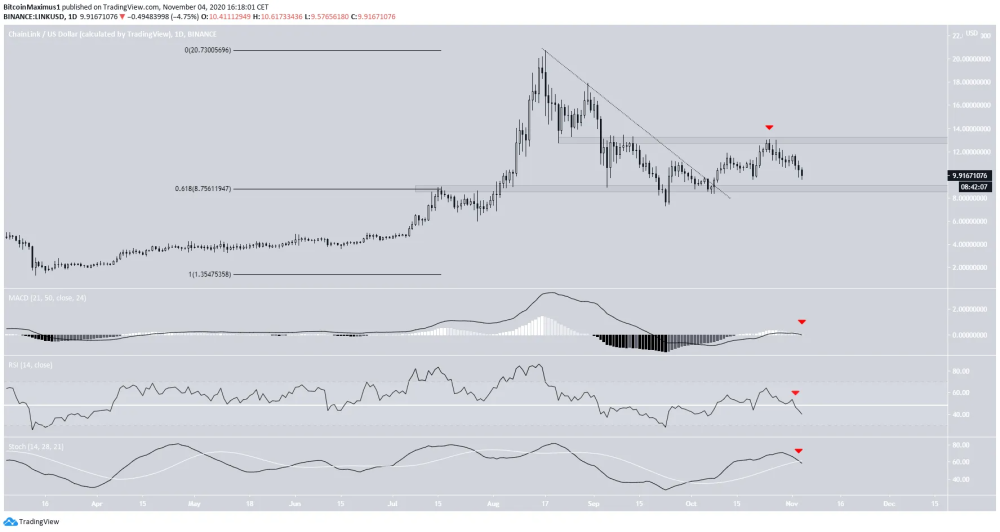
The LINK price had been following a descending resistance line since Aug 17. On Oct 8, the price proceeded to break out from this line and reach a high of $13.05. However, LINK was rejected by the $13.10 resistance area shortly afterward and has been decreasing since.
Currently, the price is approaching the $8.75 support area, which is the 0.618 Fib level of the entire upward move and likely to provide support.
Despite the strong support near the price, technical indicators in the daily time-frame are firmly bearish. The RSI has decreased below 50, the Stochastic oscillator has made a bearish cross, and the MACD is at risk of crossing below 0, all signs of a bearish trend.
Short-Term Movement
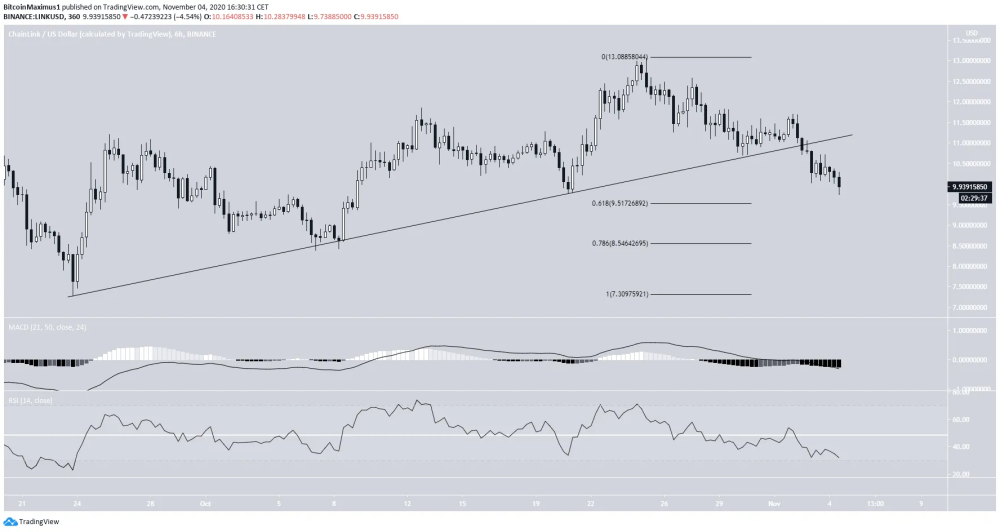
Similar to the daily time-frame, technical indicators are bearish, as the RSI is below 50 and the MACD is below 0. There are no bullish divergences present.
The two closest supports are the 0.618 and 0.786 Fib levels at $9.51 and $8.54, respectively. The latter level coincides with the previously mentioned support area, making it a more likely level to act as the bottom.
Wave Count
The movement since the Sept 23 low looks like a leading diagonal (shown in blue below), which is likely a part of a long-term A wave (black).
Currently, it seems that the price is in the B wave, which is expected to end at either $9.50 or $8.50 before an upward move follows.
While the target for the C wave depends on the bottom of the B wave, a preliminary target is found at $15.21, the 0.618 Fib level of the entire decrease since the aforementioned Aug 17 high.

To conclude, the LINK price is expected to continue its descent for a short period of time before reversing its trend and moving upwards towards the resistance targets given above.
Also, If you are interested in trading, I would suggest you try out BeInCrypto's free Telegram chat. I am there and it is growing very quickly (over 8,300 members) where they discuss the market and share interesting content. They also have a free premium channel where they have a cryptocurrency trading course and daily trading signals. If you are interested, you can click here.
Until next time, stay classy crypto world!


