
On Nov 19, the Bitcoin (BTC) price reversed its potential decrease and broke out from a short-term symmetrical triangle.
The price is expected to continue increasing towards the closest resistance area.
Bitcoin Parabolic Ascending Support
The Bitcoin price has been following a parabolic ascending support line since the beginning of September. On Nov 18, the price seemingly stalled by creating a spinning top candlestick, suggesting that a reversal might occur.
However, BTC continued to move upwards and is in the process of creating another bullish candlestick. The parabolic ascending support line is still intact.
The closest resistance area is found near the all-time high of $19,500.
Technical indicators show that the rally is overbought, but there is no bearish divergence yet to warn of an impending reversal.
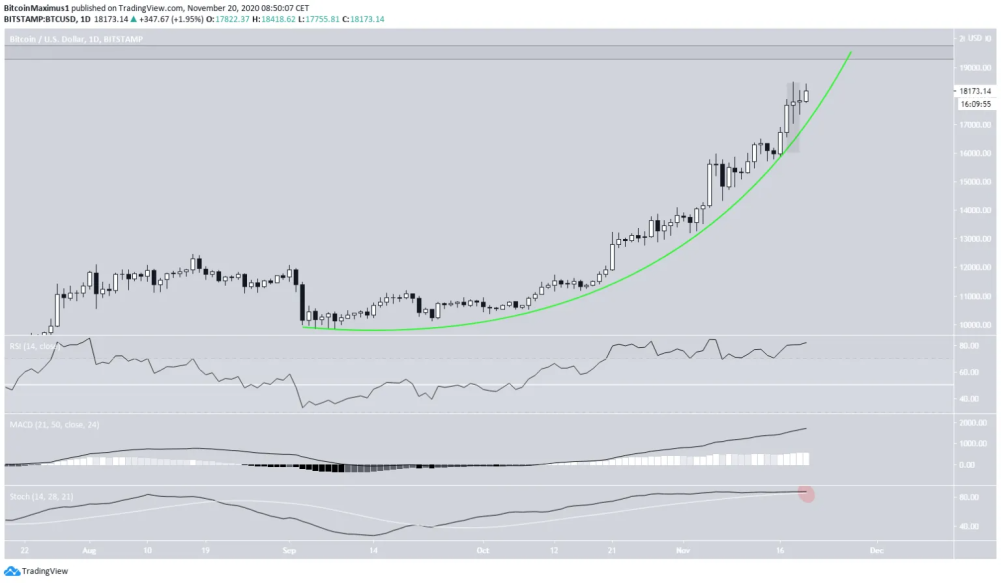
The resistance area is better visualized by the long-term chart, which shows that the price is in the process of creating a considerable bullish candlestick in the weekly time frame.
BTC has cleared all significant Fib resistance levels, leaving only the all-time high left before bullish price discovery.

Short-Term Breakout
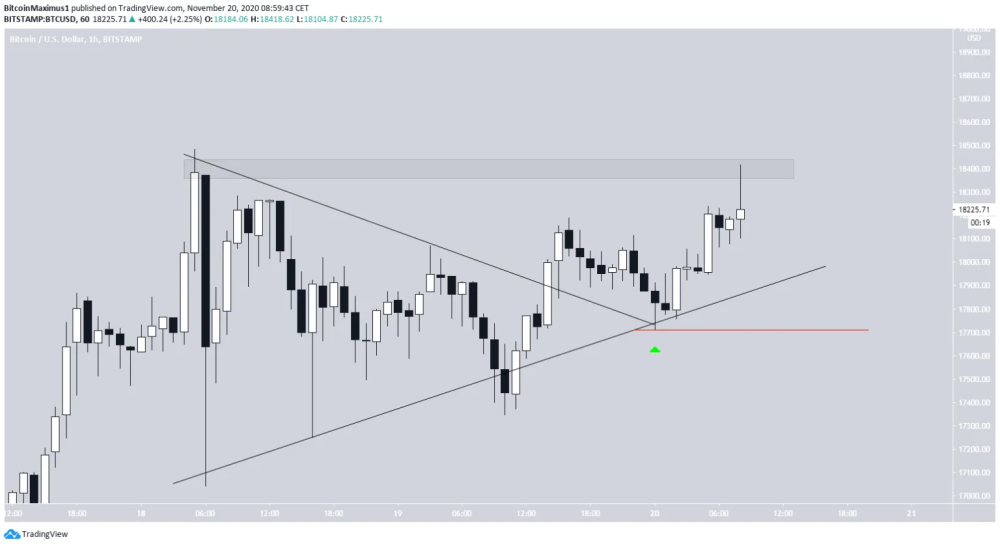
The shorter-term chart shows that the BTC has already broken out from a symmetrical triangle, validated it as support, and continued to move upwards. However, BTC has been rejected near $18,400, the Nov 18 highs.
Nevertheless, as long as BTC is following the ascending support line from the triangle, it is expected to eventually break out and continue moving towards $19,500.
BTC Wave Count
In yesterday’s Bitcoin movements, the long-term count showed that the price is likely in the fifth and final wave of a bullish impulse that began in March and suggests a high near $20,000.
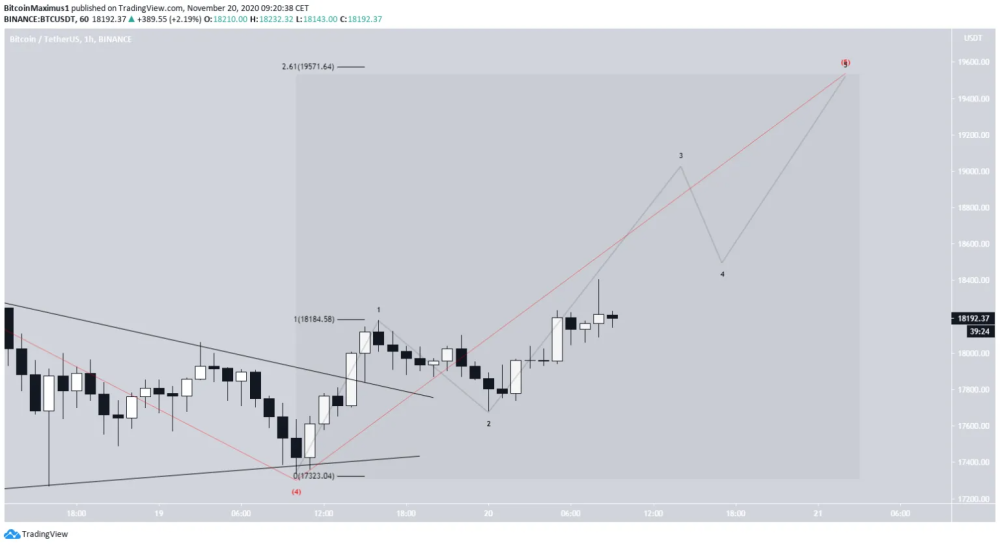
The shorter-term count indicates that the price is in the fifth and final sub-wave (orange) of this impulse, indicating a high between $19,182 (the 2.61 Fib extension of sub-wave 1) and $19,598 (the 0.618 Fib projection of waves 1-3).

Looking at an even shorter-term chart, we can see that the price has completed the first and second minor sub-waves (black), and is likely to soon accelerate its upward move towards the $19,500 high.
Conclusion
After breaking out from a symmetrical triangle, the BTC price is expected to continue increasing towards the closest resistance area near the $19,500 all-time high price.
Also, If you are interested in trading, I would suggest you try out BeInCrypto's free Telegram chat. I am there and it is growing very quickly (over 8,600 members) where they discuss the market and share interesting content. They also have a free premium channel where they have a cryptocurrency trading course and daily trading signals. If you are interested, you can click here.
Until next time, stay classy crypto world!


